

Debugger
The debugger is the source of the script, with what each line caused beside it: tool calls with their duration, log lines, timers, signal waits. Above it, the timeline shows each call, timer and signal wait as a span, with idle time compressed. When the run waits, a banner says for what, at which line, and how to answer.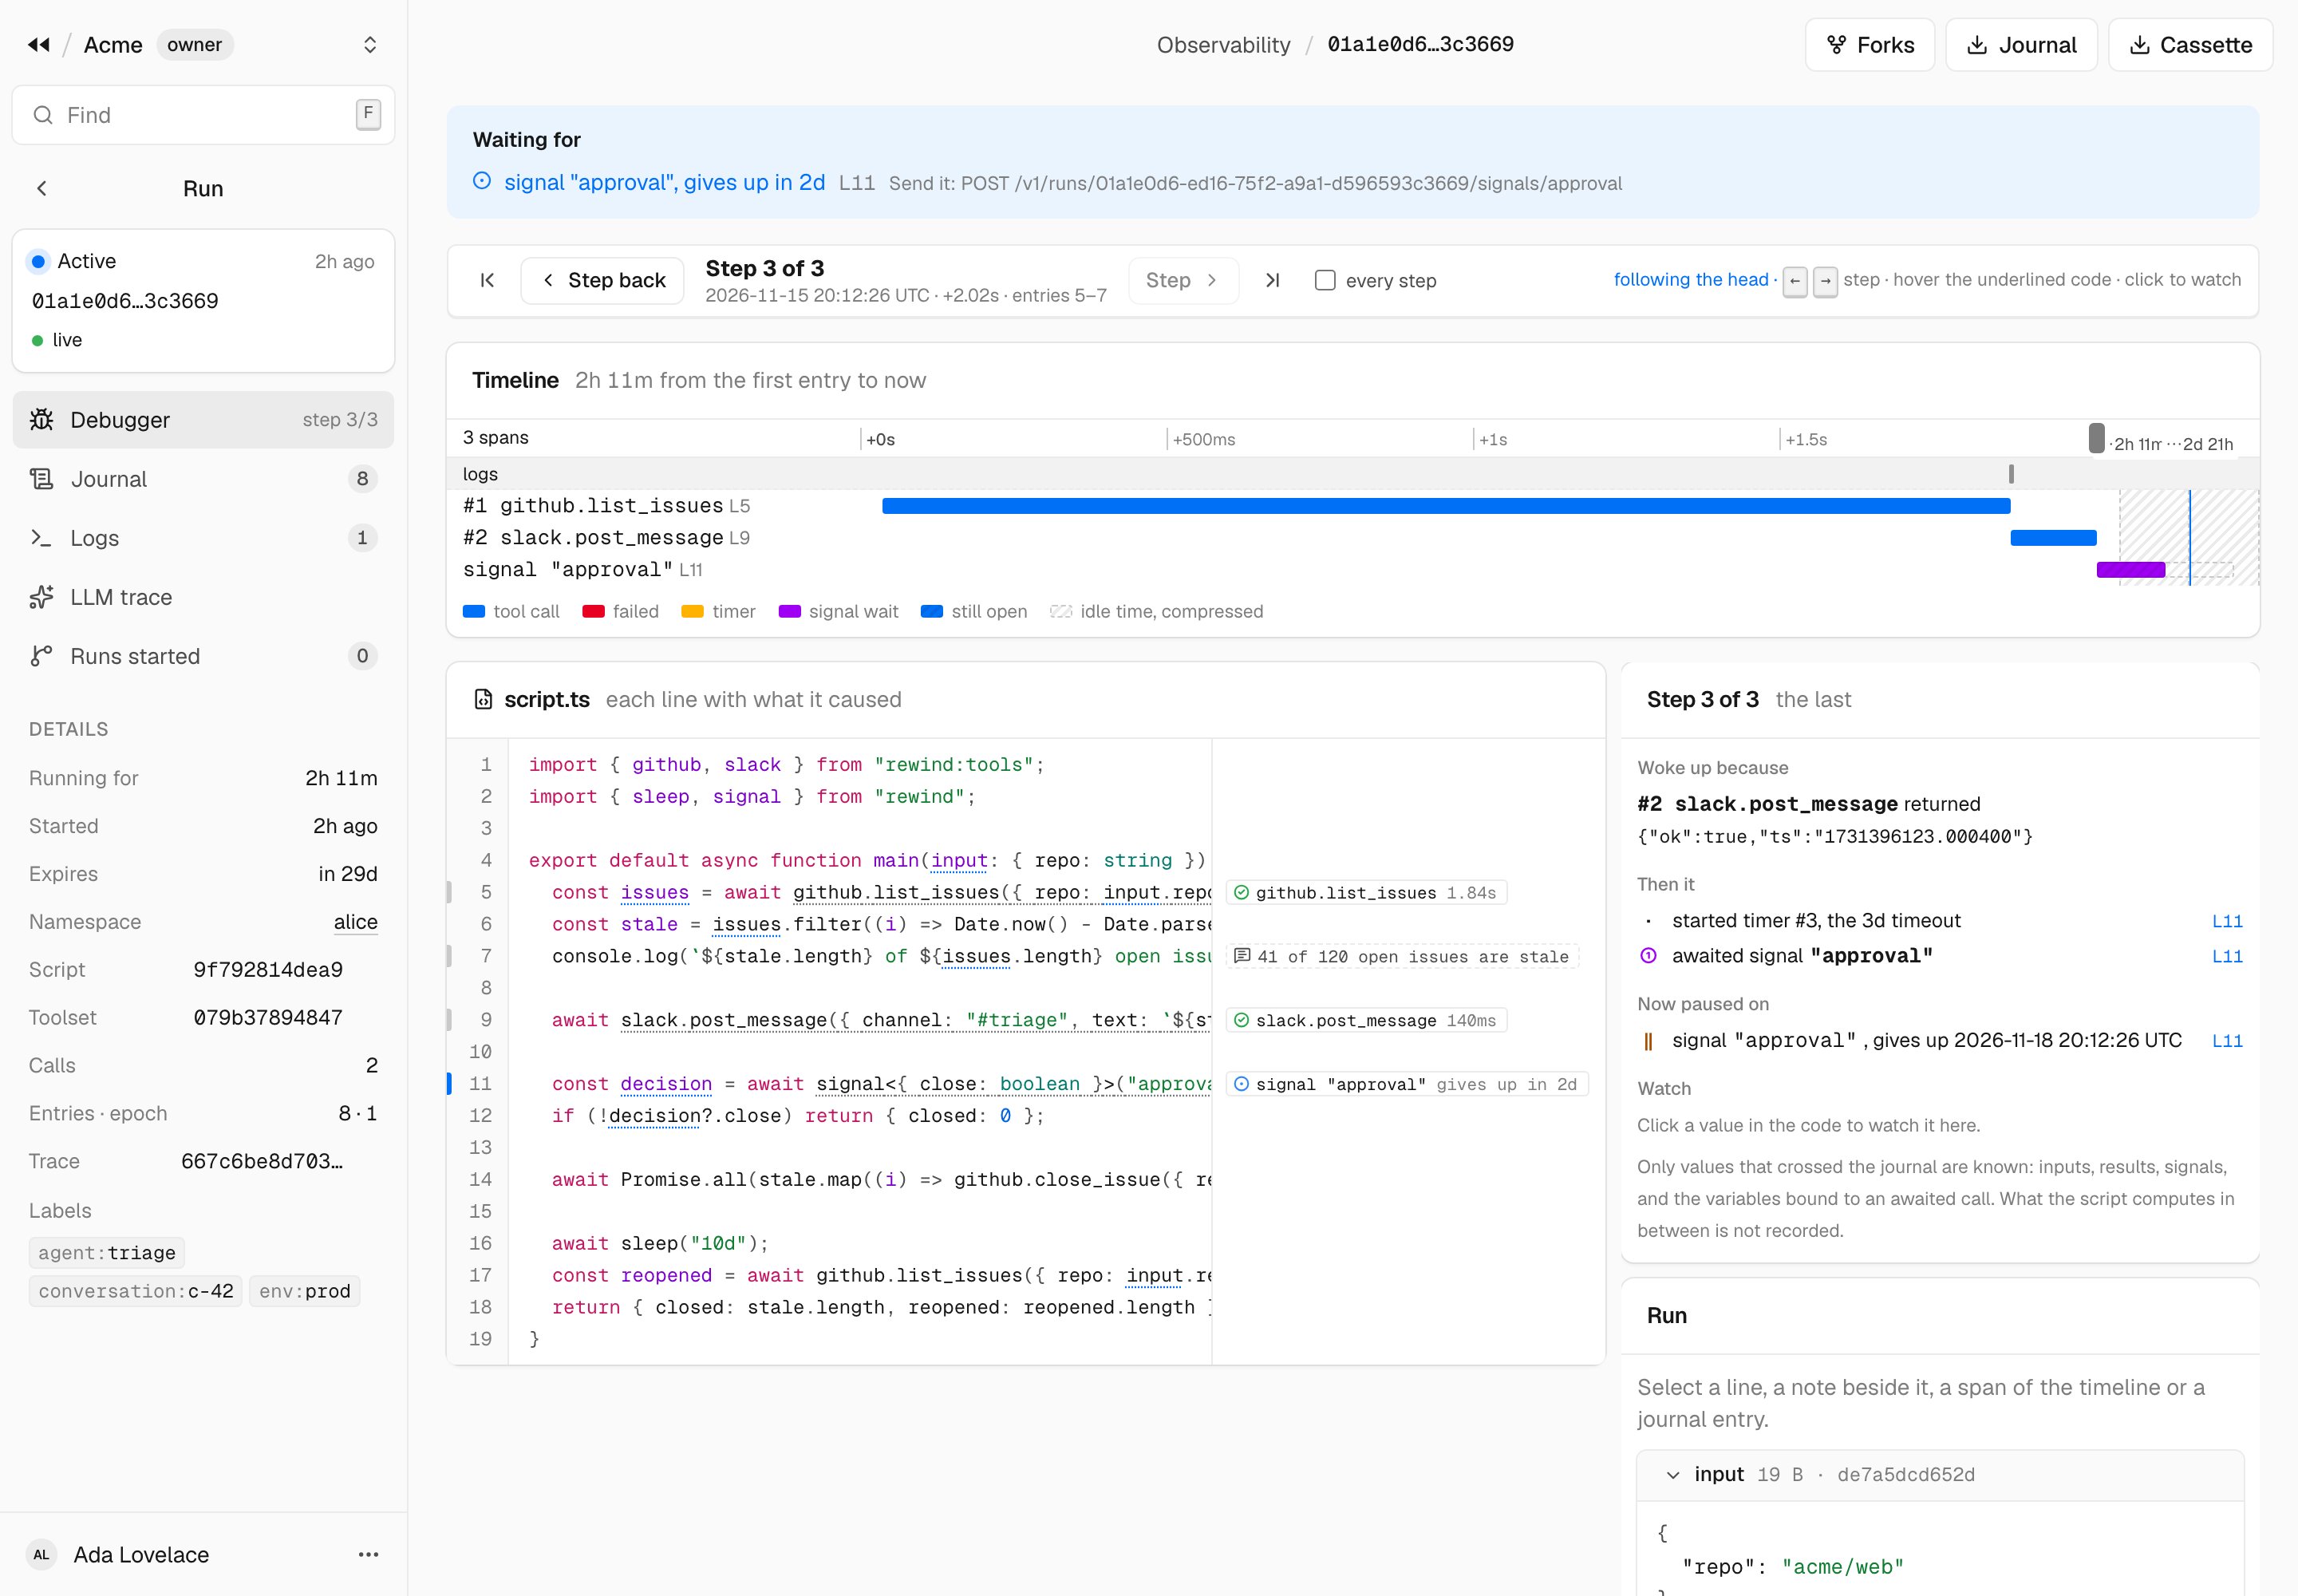
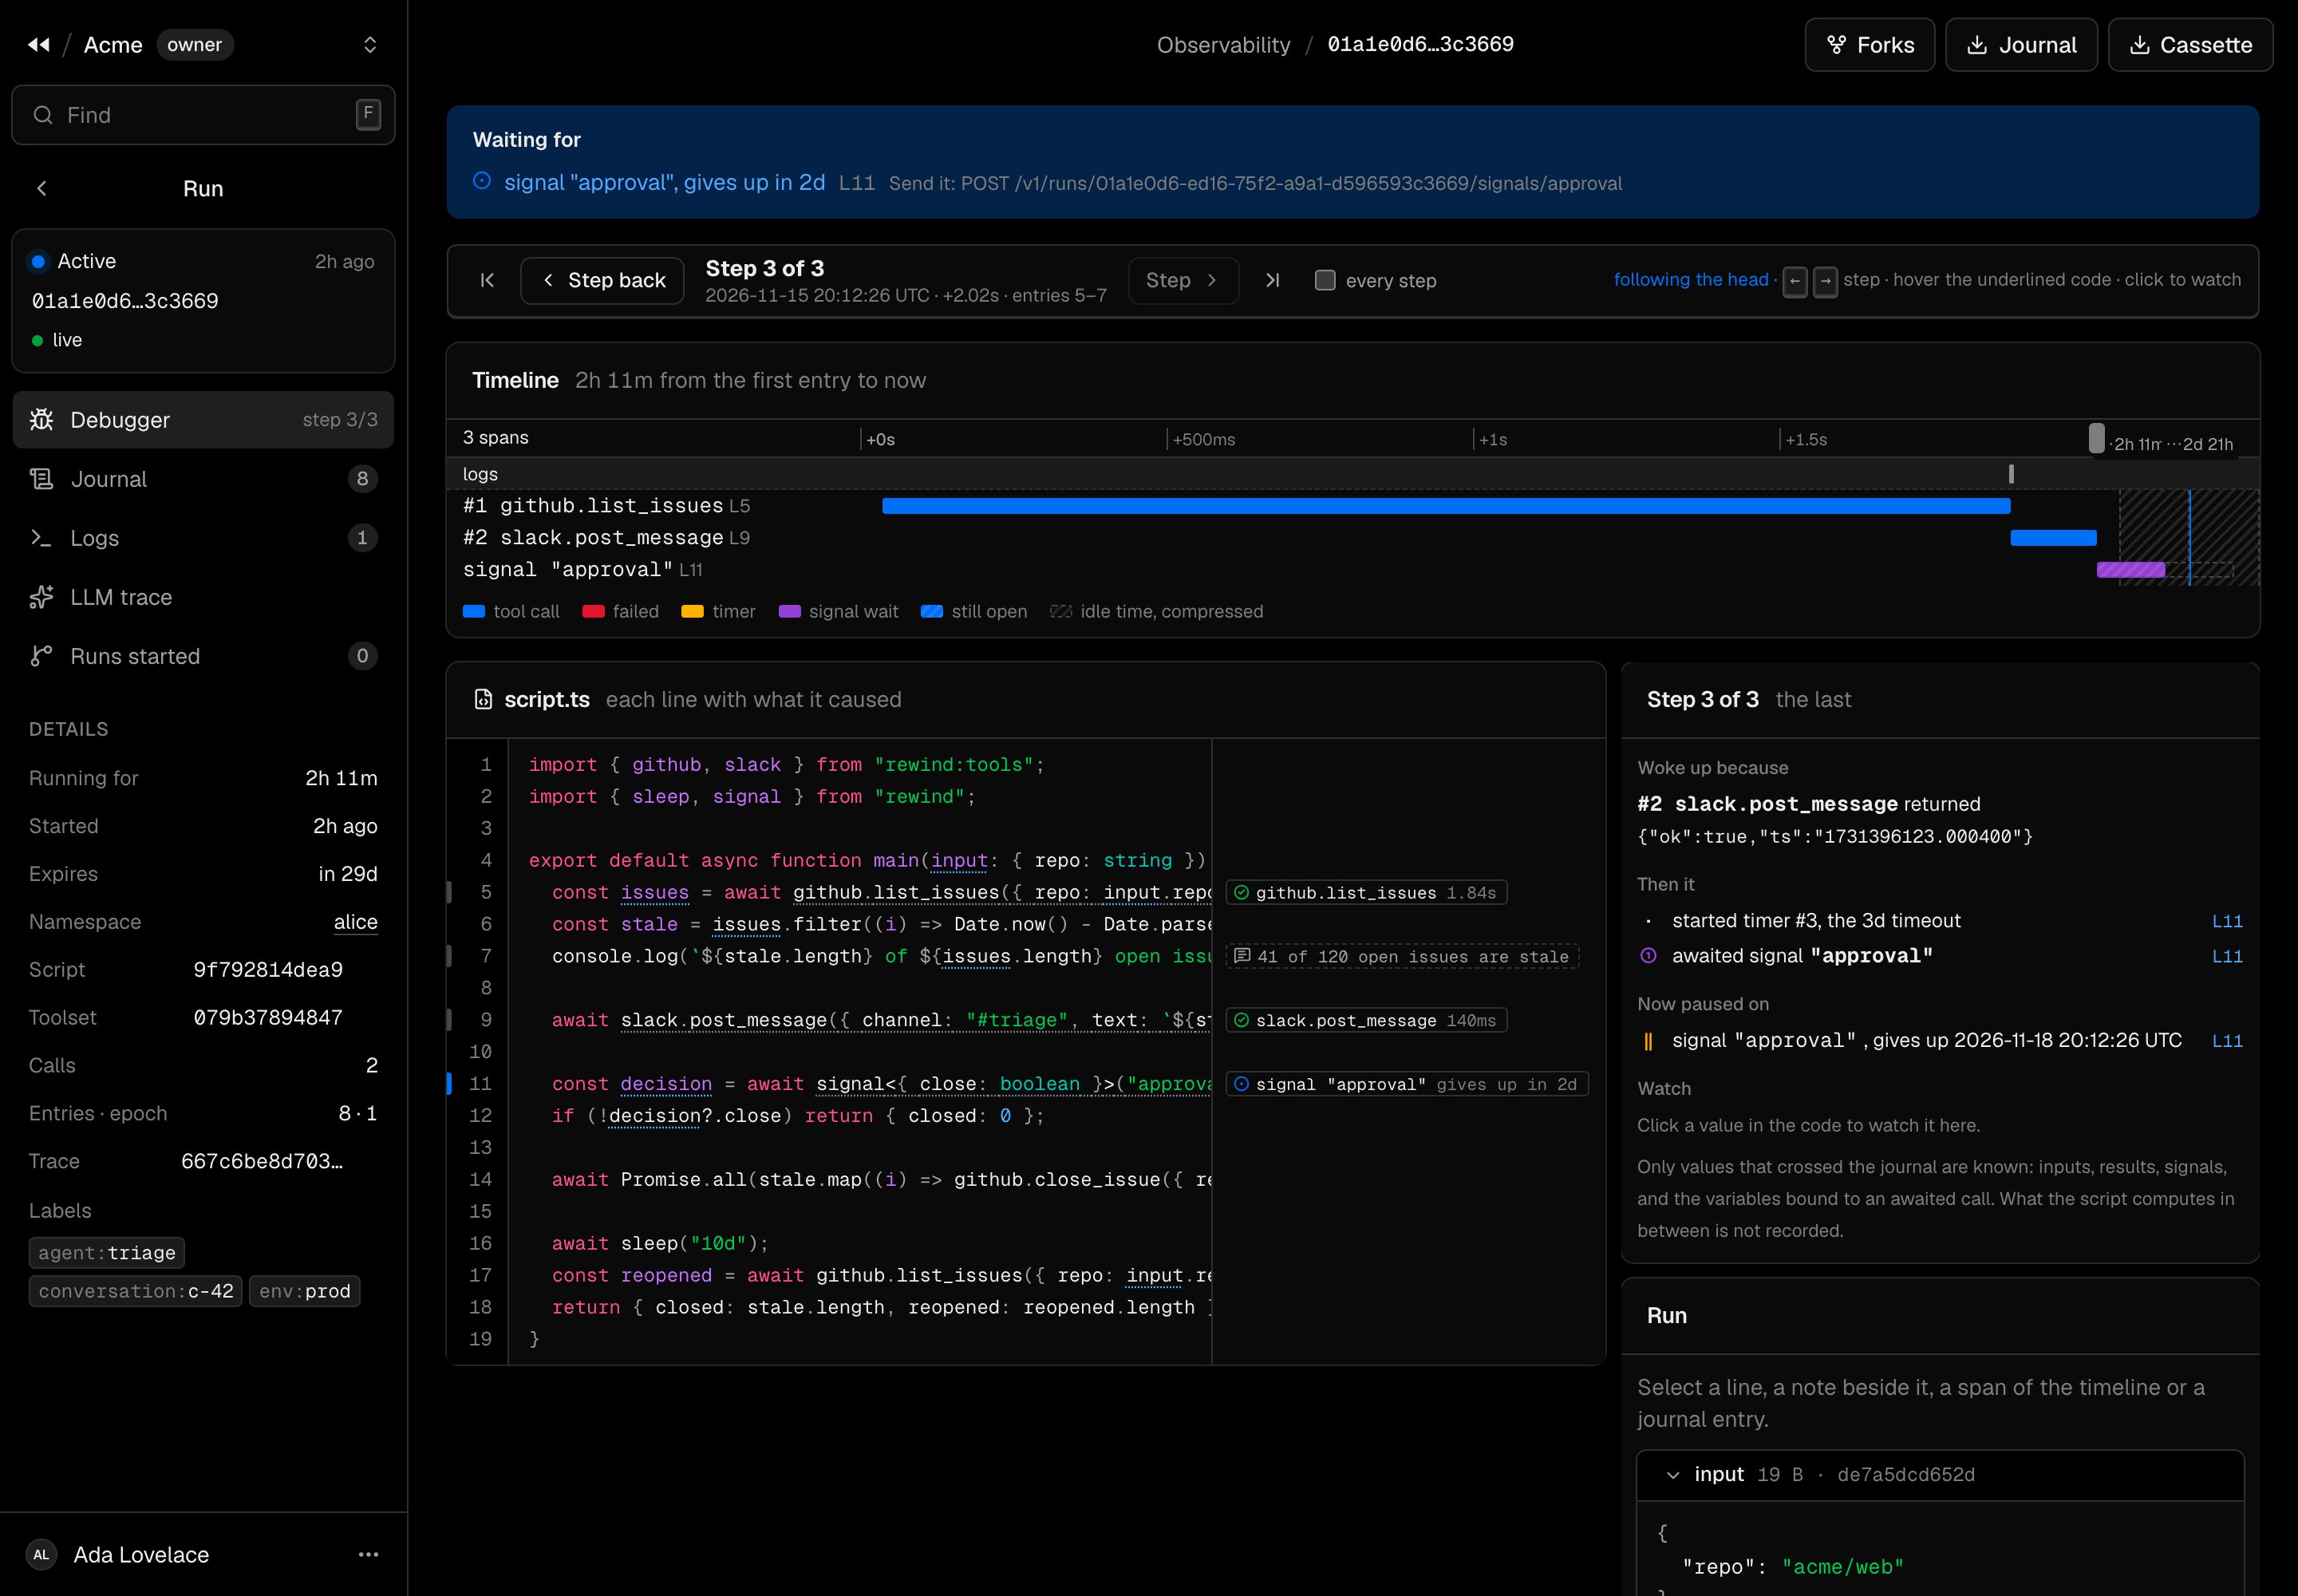
A run waiting for the signal approval, at line 11, after two calls
The time cursor
A run’s history is a sequence of steps: something from outside (the start, a tool’s result, a timer, a signal, a cancellation) and what the script did in response. The cursor steps through them like a debugger:- Step back, Step, first and last, or the ← and → keys. every step also stops on the steps that change nothing in the source.
- At each step, the source marks the awaits that just resumed, the calls issued, those still open and those done. The panel on the right says why the run woke up, what it did, and where it is paused.
- Hover an underlined call to see its arguments and result as known at that step, or a variable bound to an awaited
call (
const issues = await github.list_issues(…)), orinput, to see its value. Click to pin it as a watch. - The step is in the URL (
?step=): a link opens the run at that moment. On a live run, the cursor follows the head.
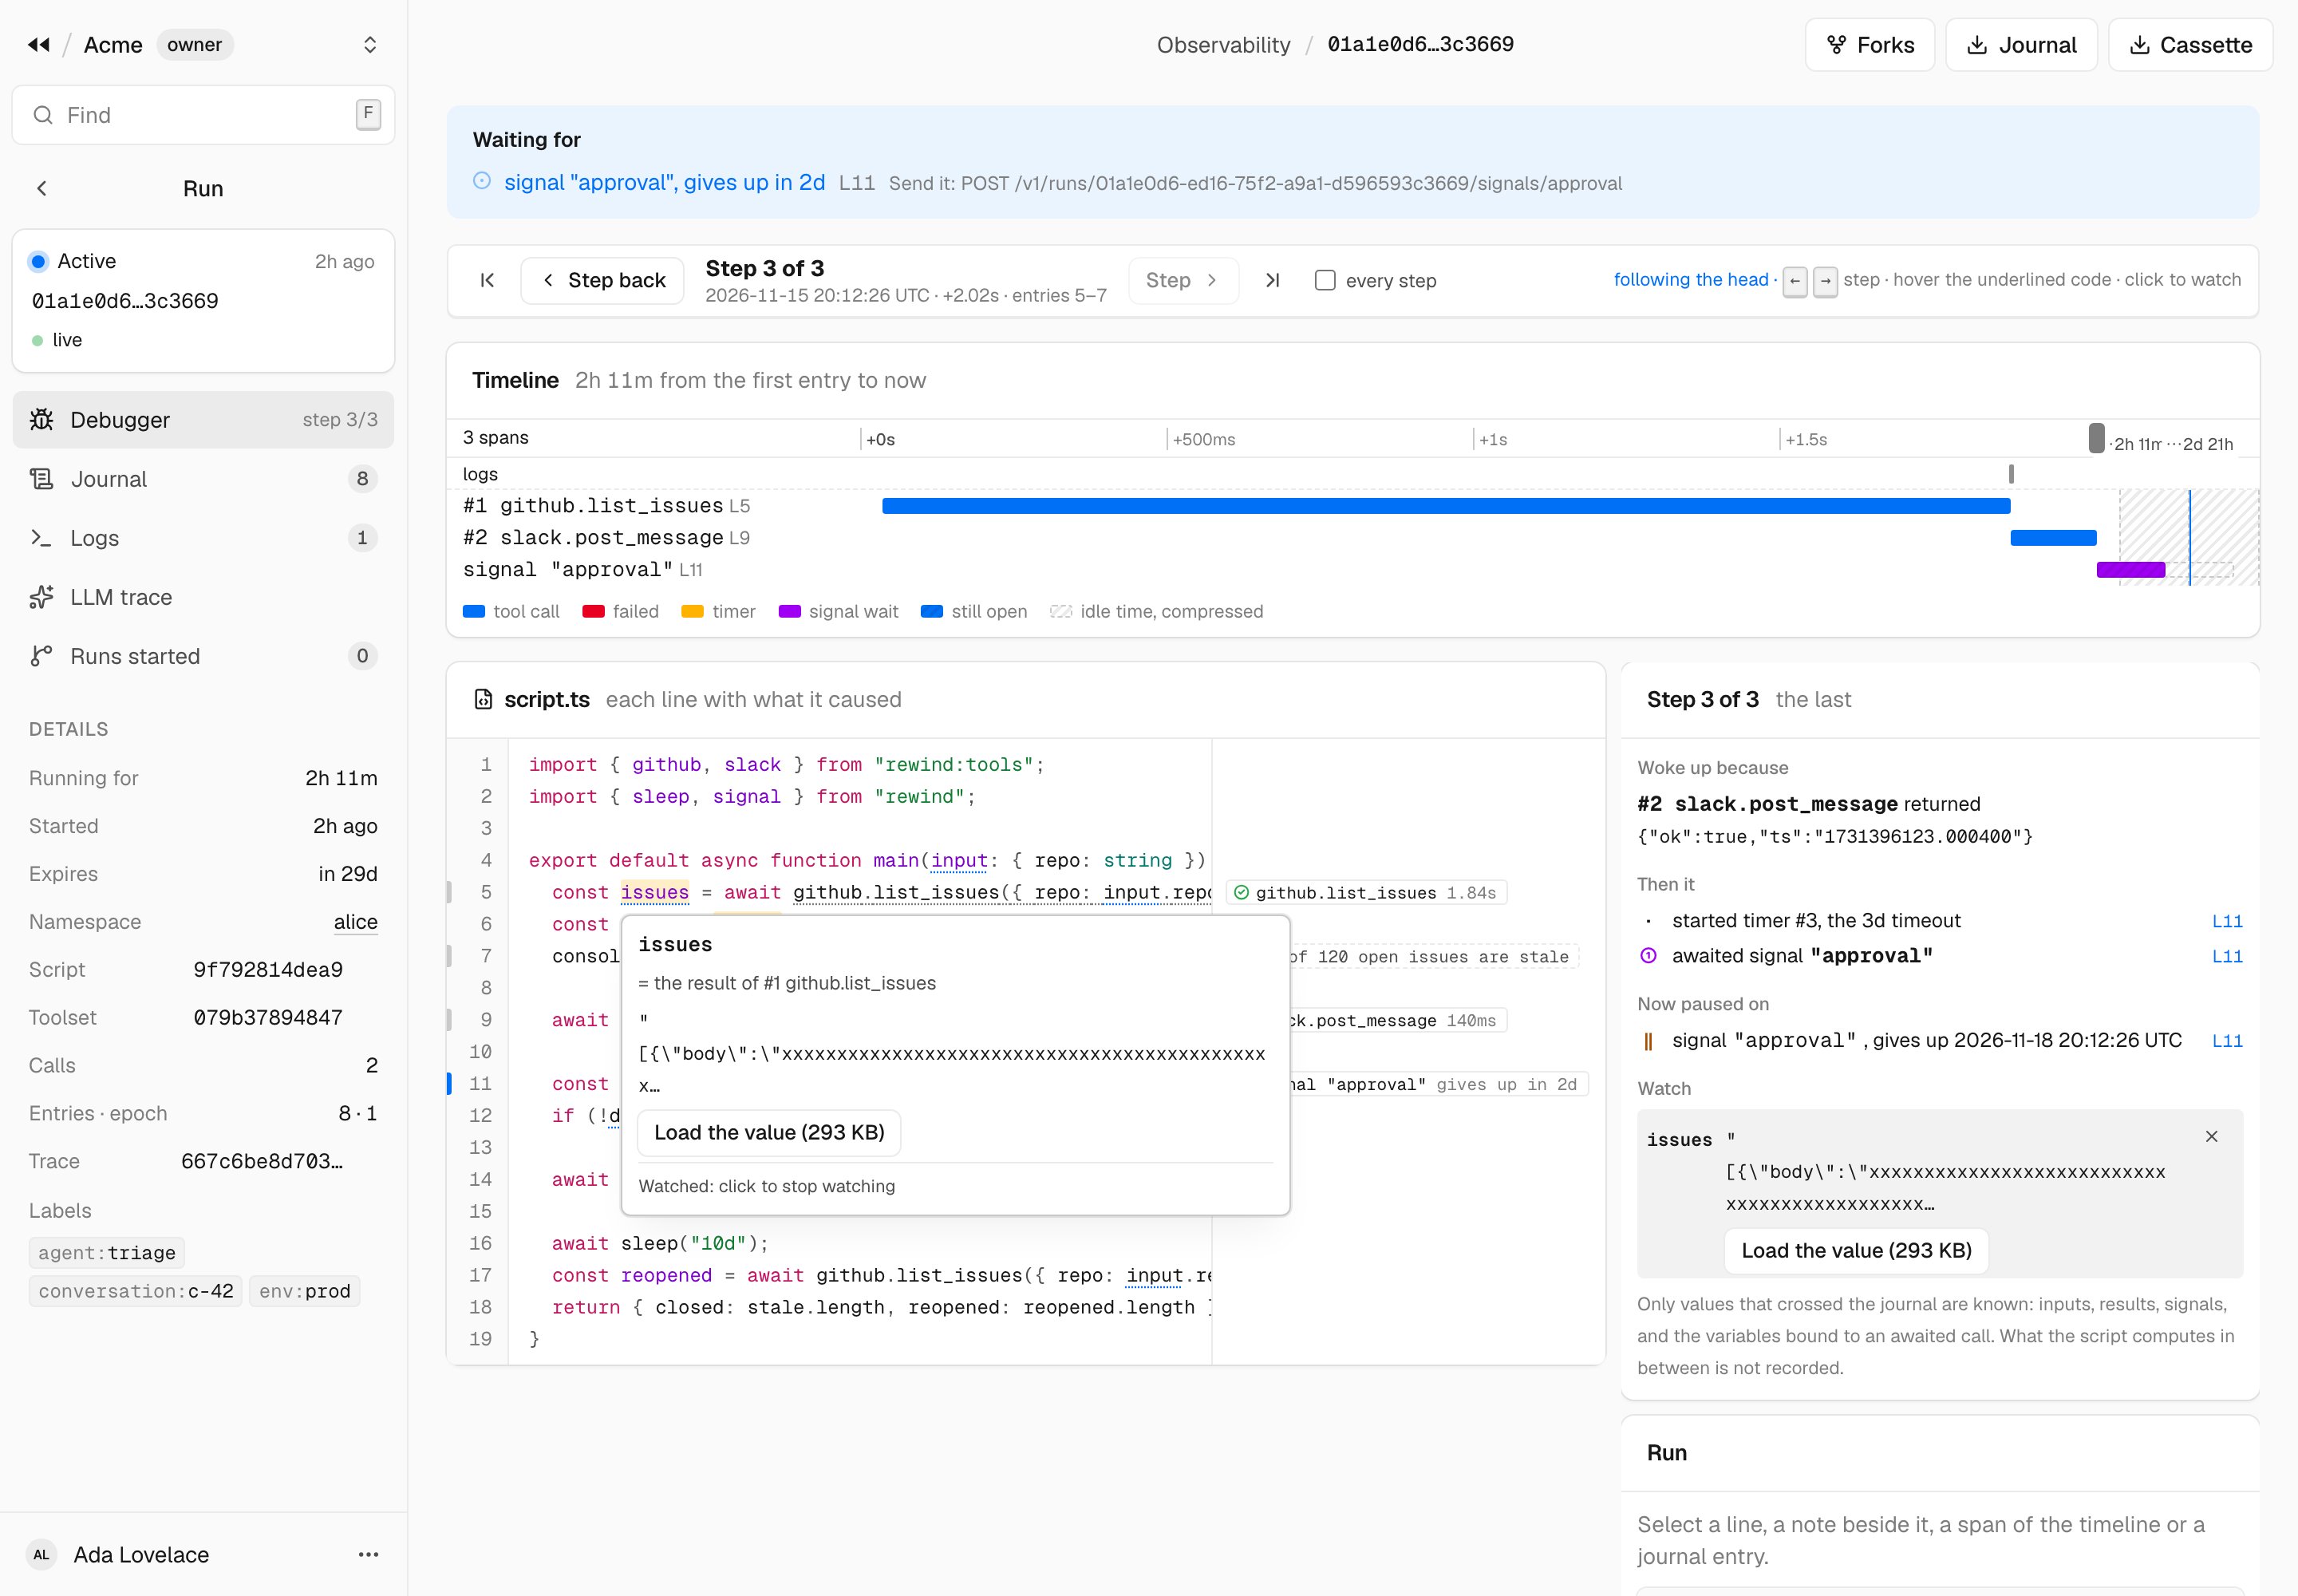
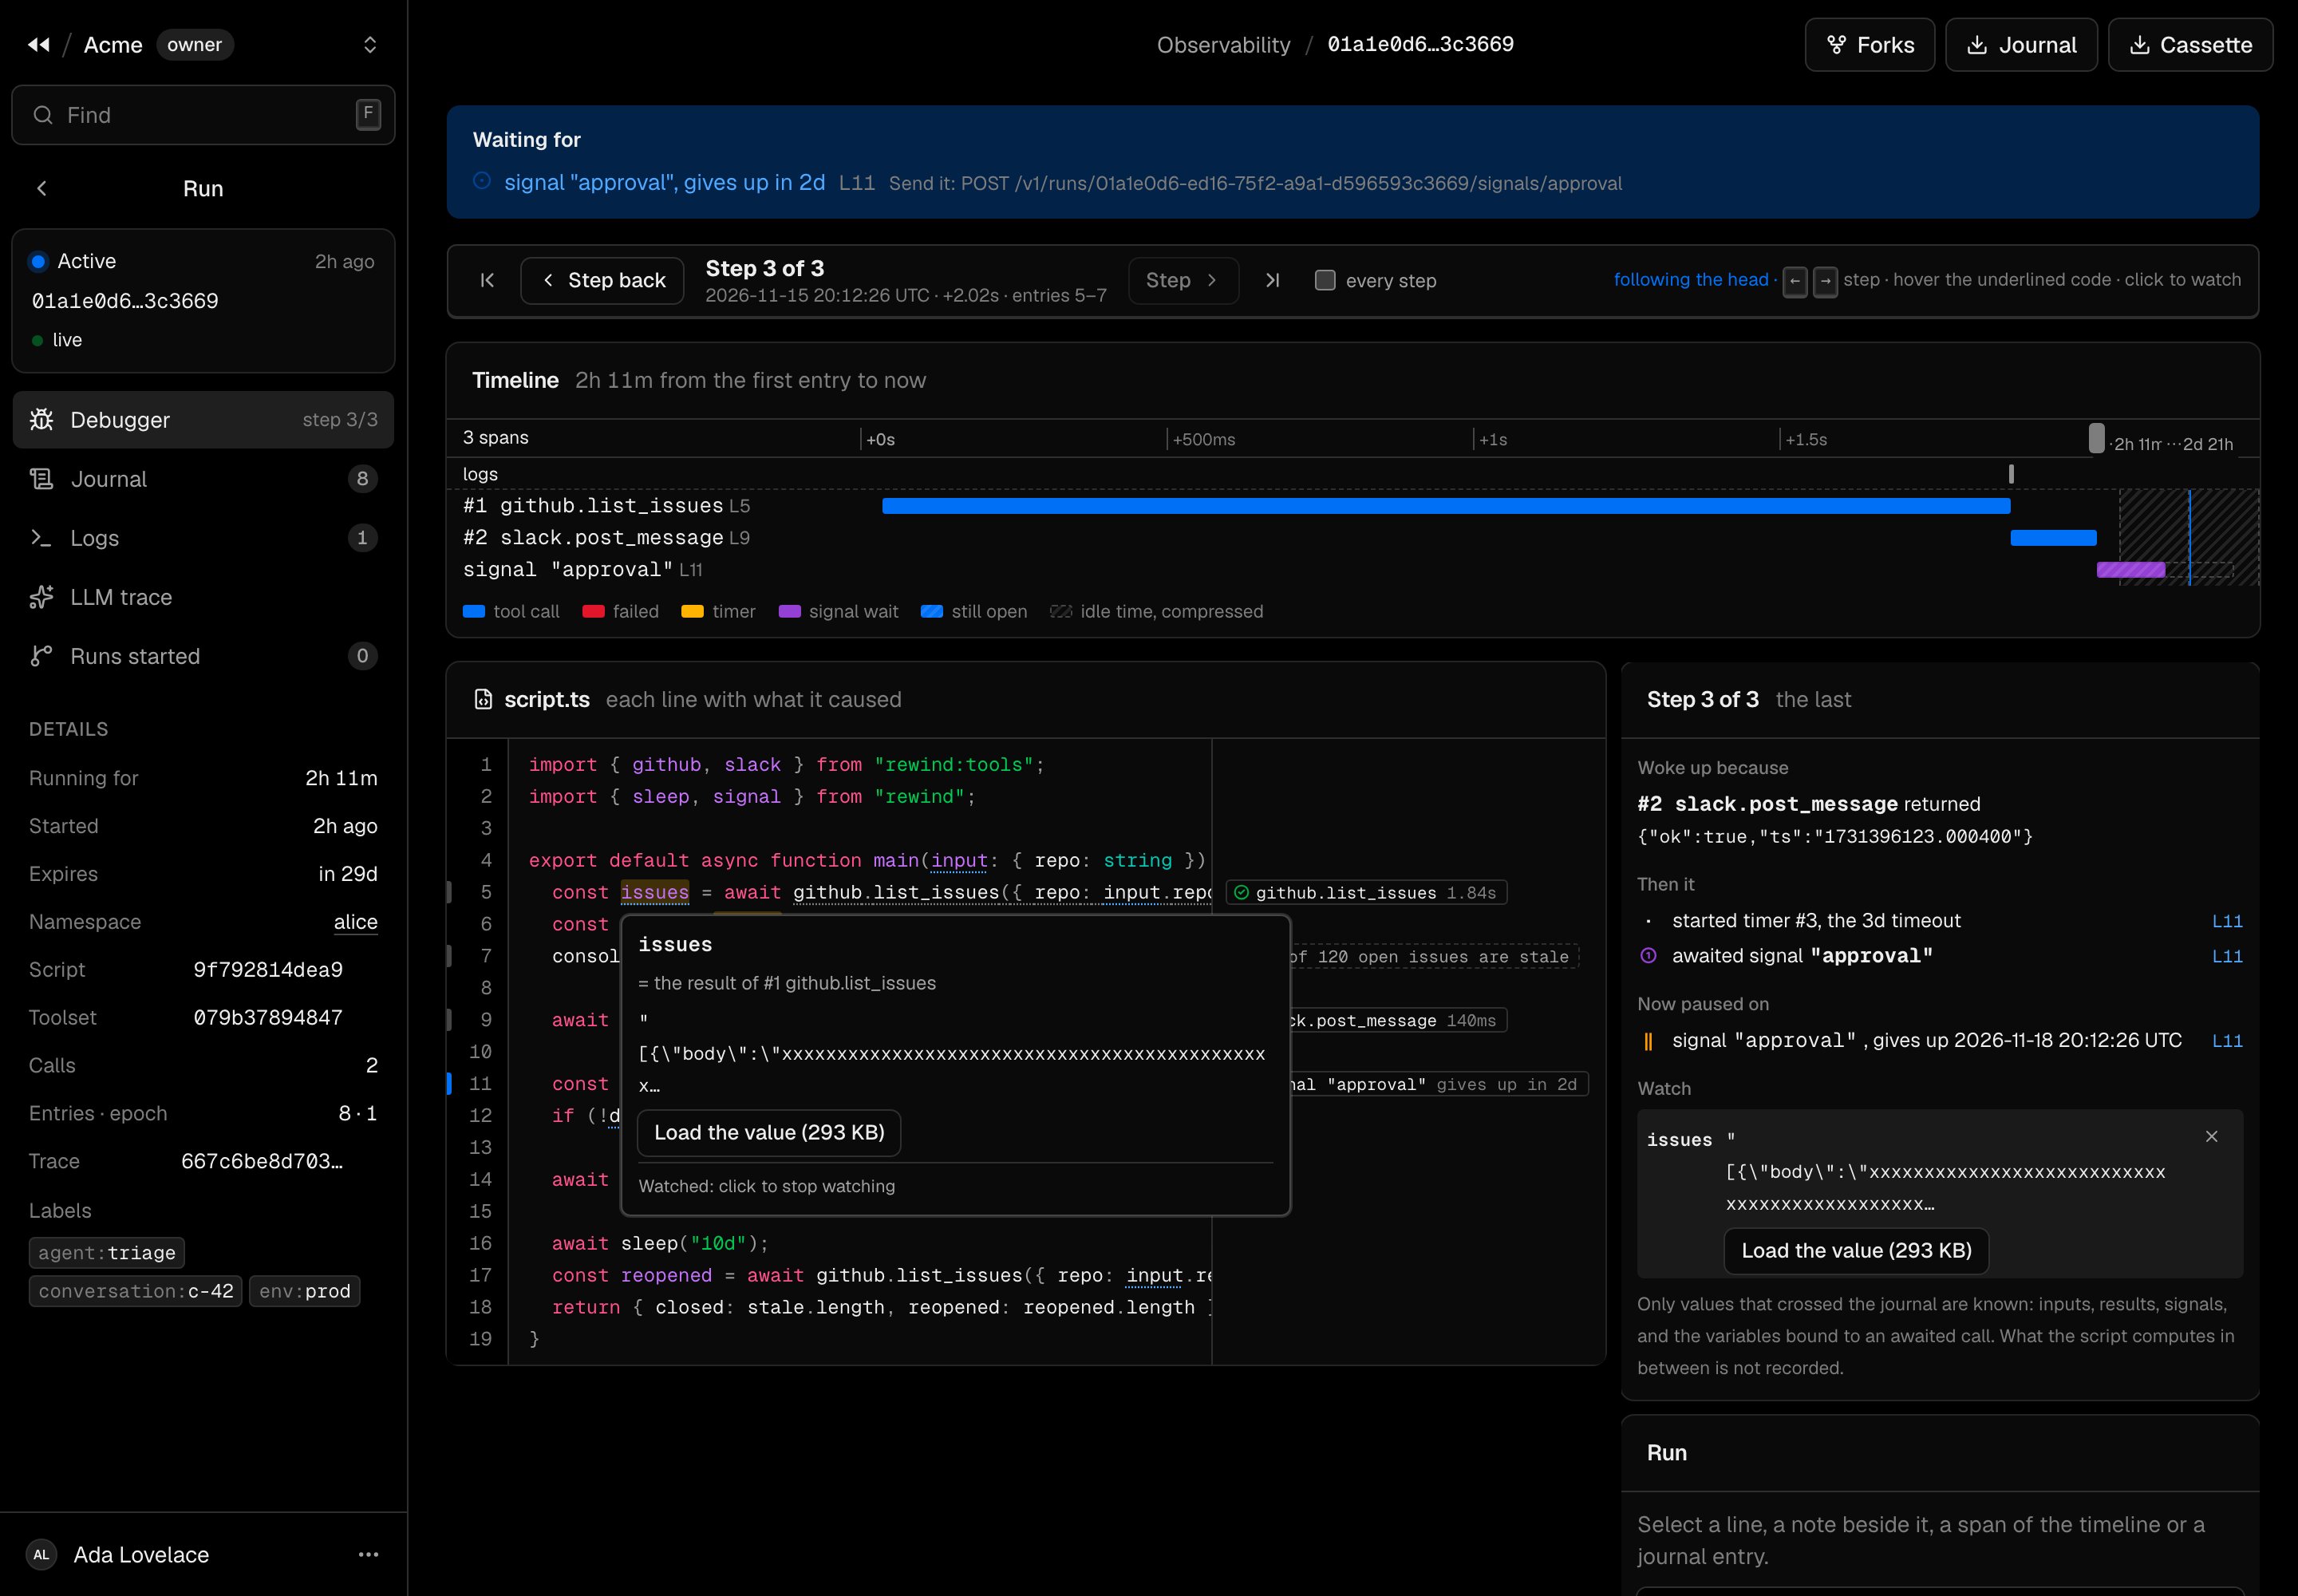
Hovering issues at step 3: the value github.list_issues returned, with a watch pinned
Only values that crossed the journal are known: inputs, results, signals, and the variables bound to an awaited call.
What the script computes in between is not recorded, and the dashboard runs no code.
Journal
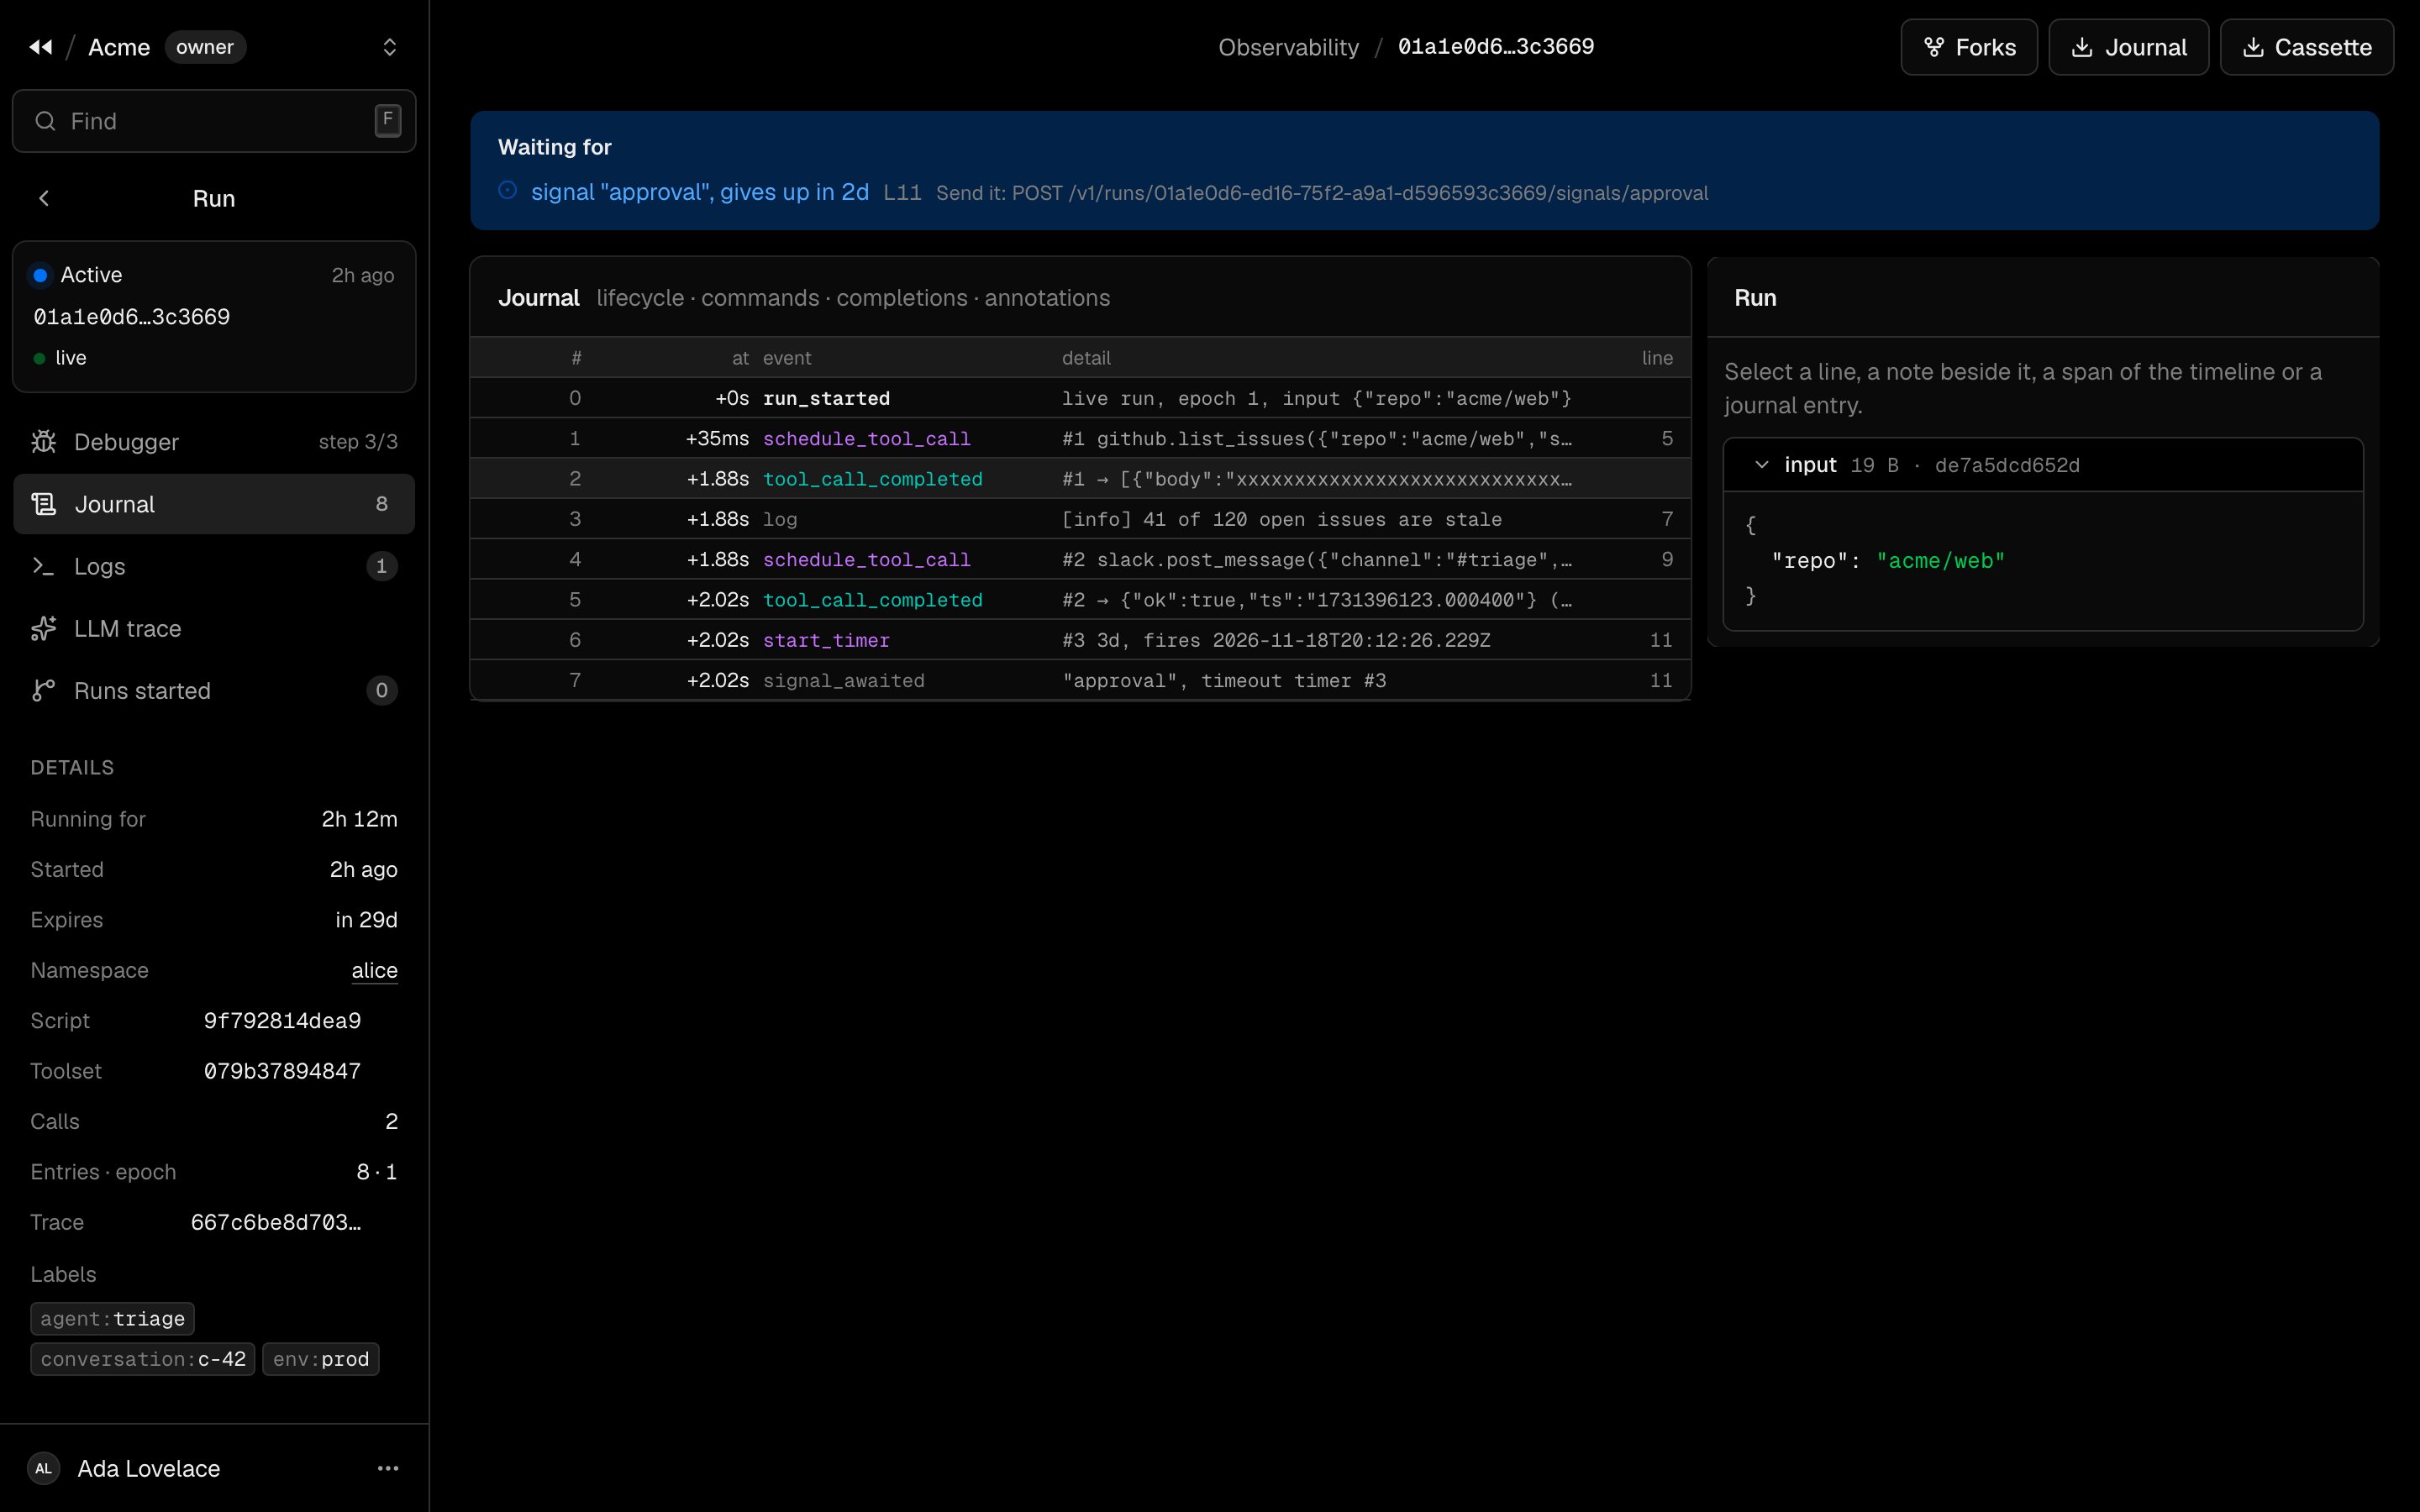
Every entry of the run: its index, its time from the start, its event, its detail and its line. Select one to see it in full.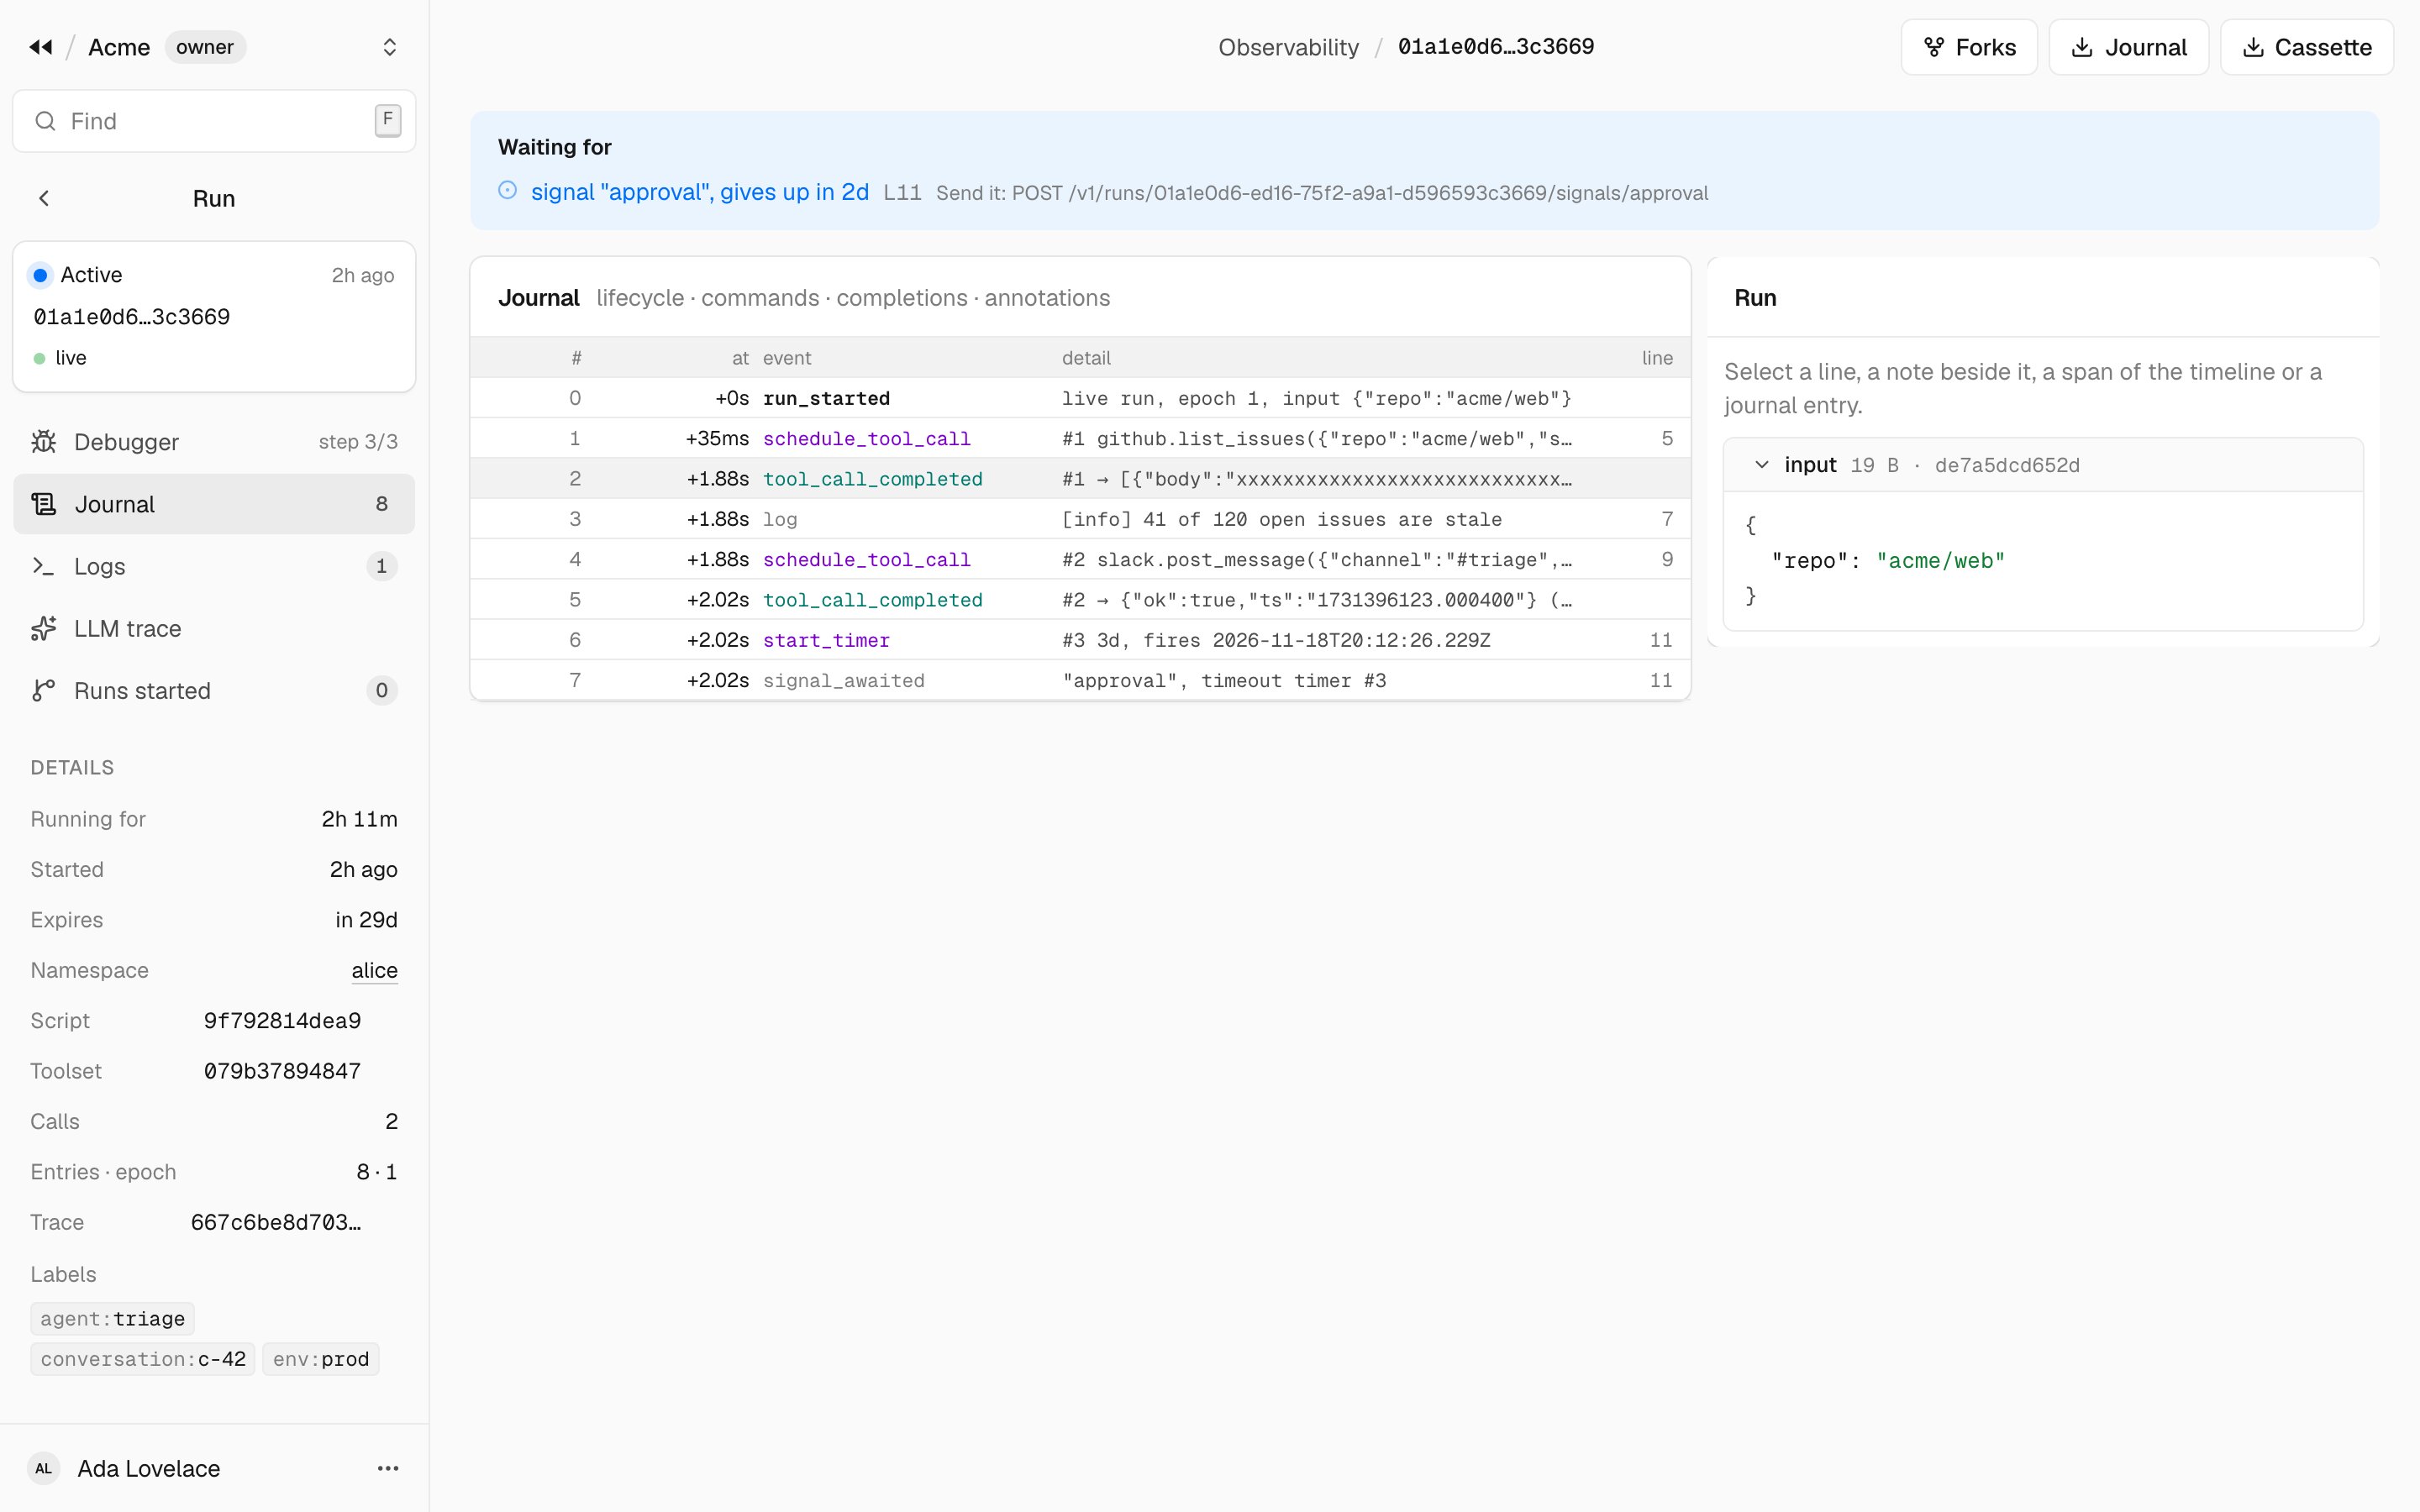
Logs
The script’sconsole.* lines, with their level and line.
LLM trace
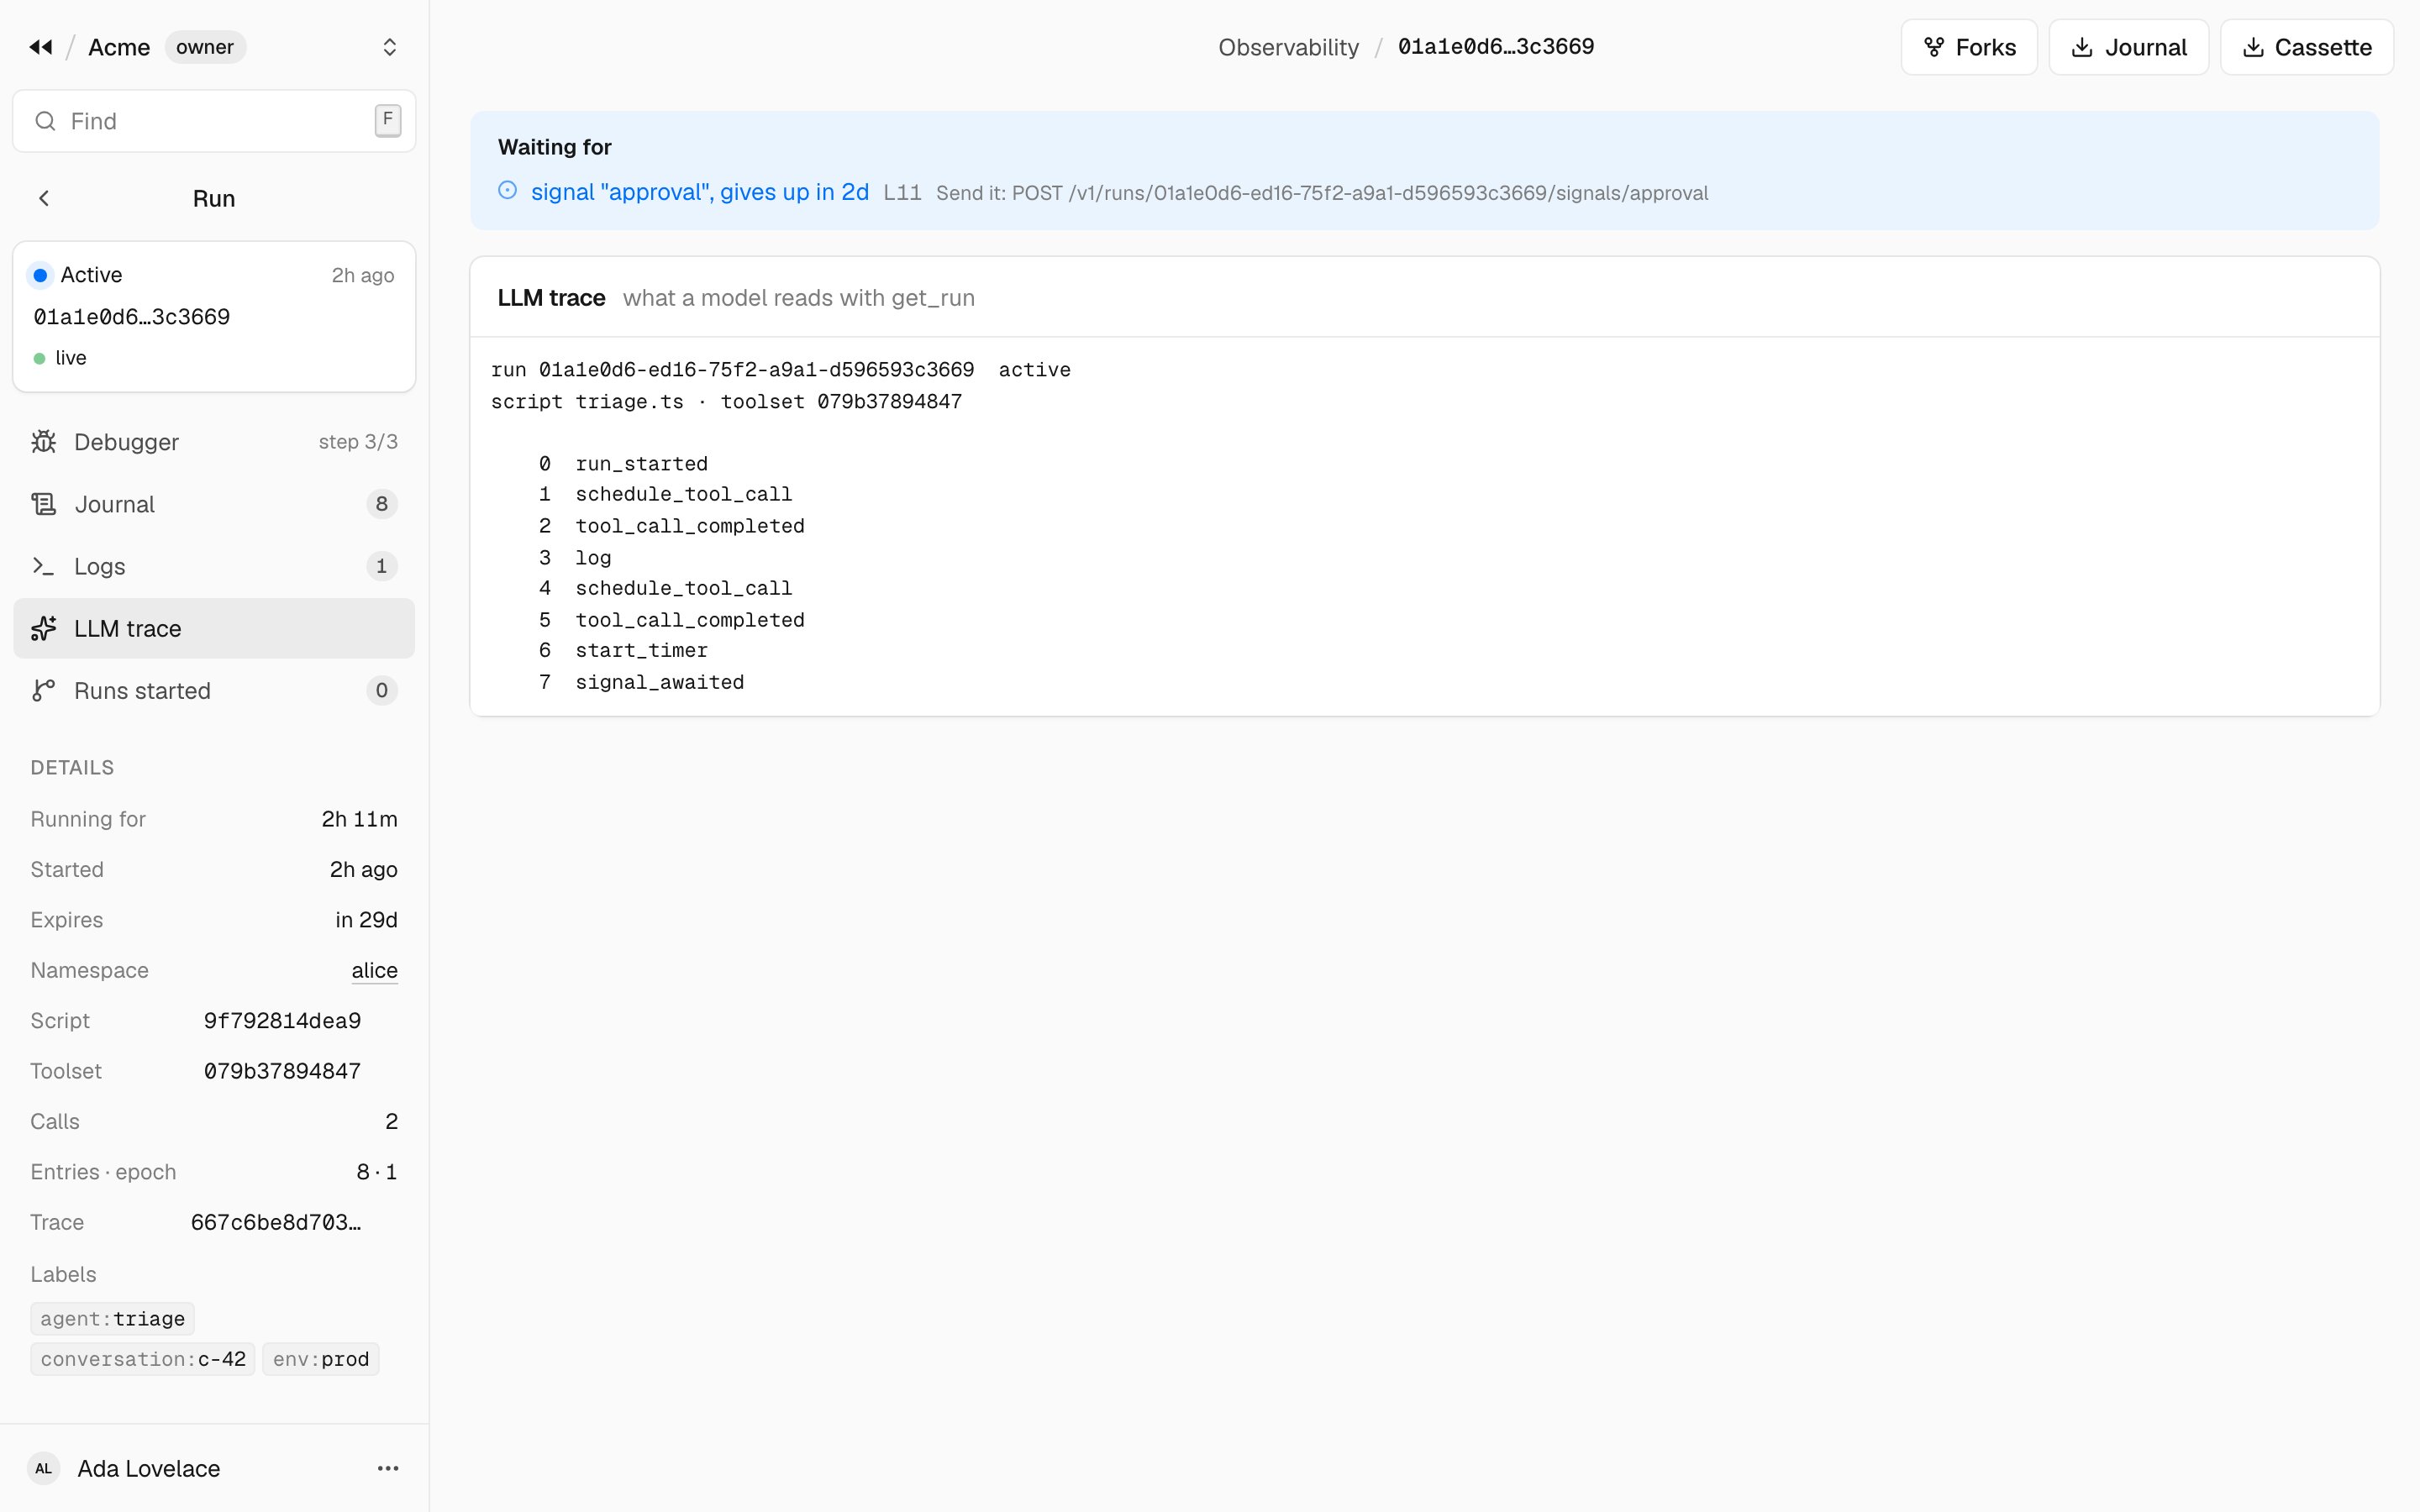
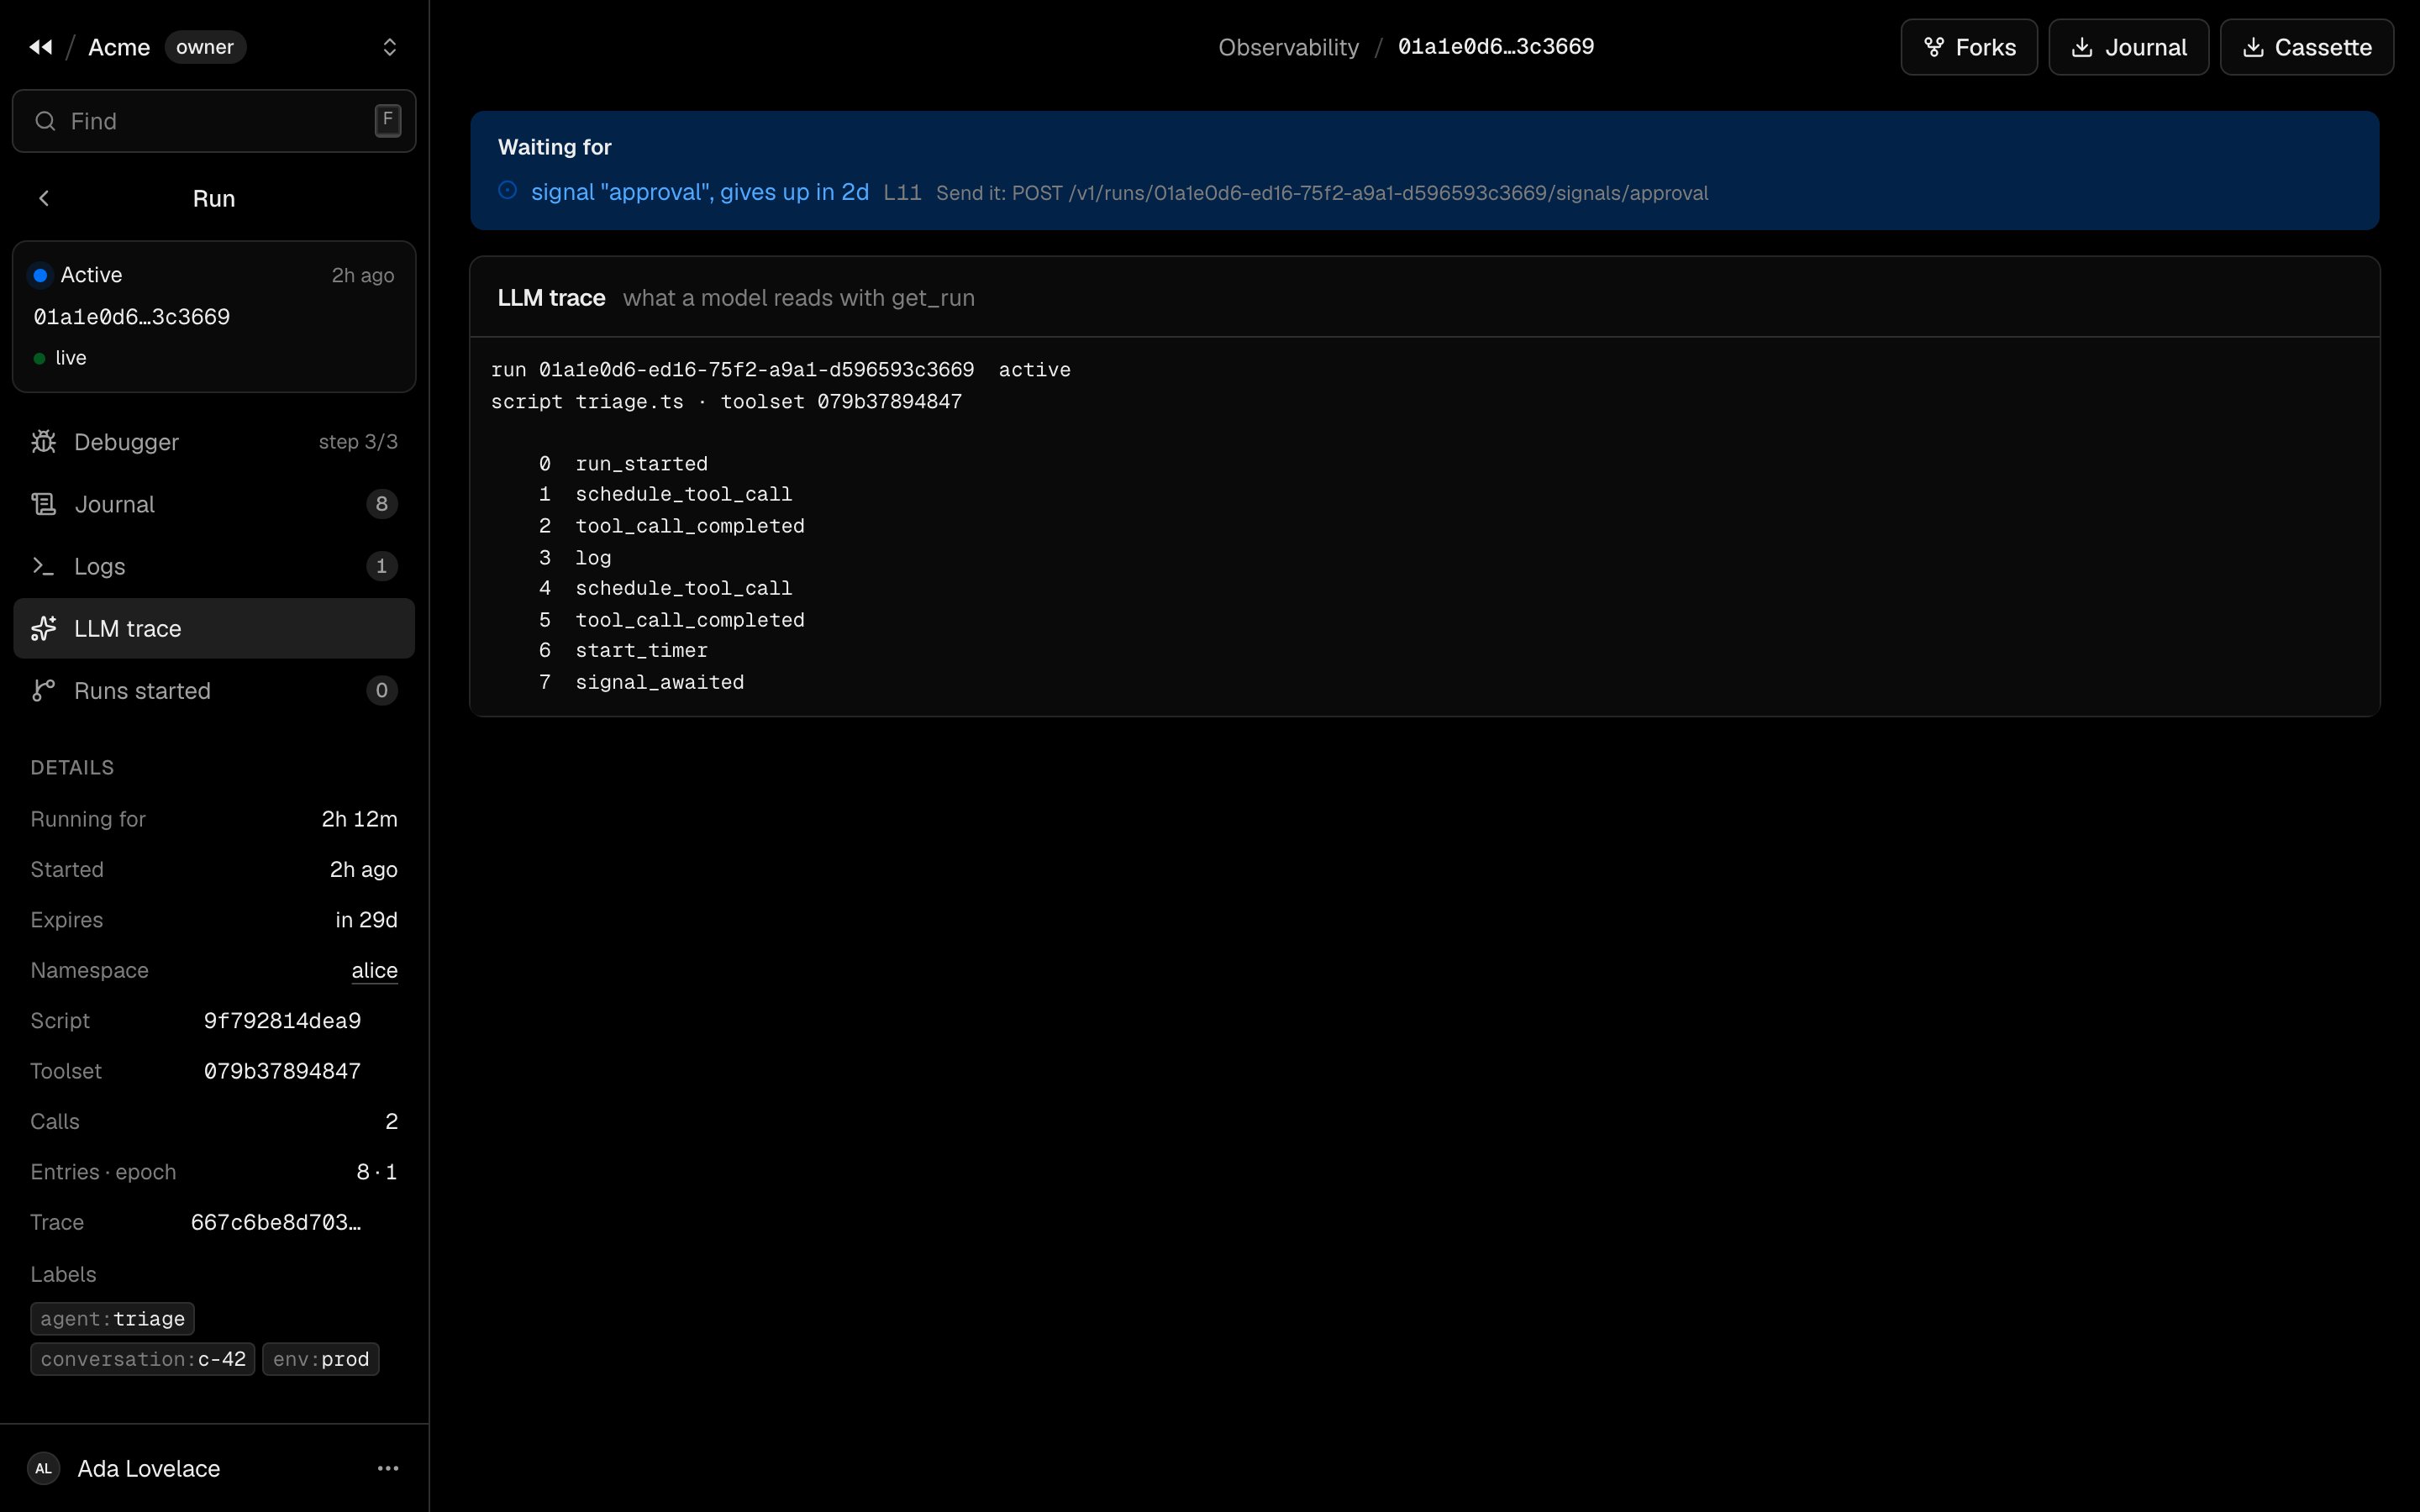
The run as a model reads it withget_run: each event with its outcome, compact. Use it to see what your agent saw.
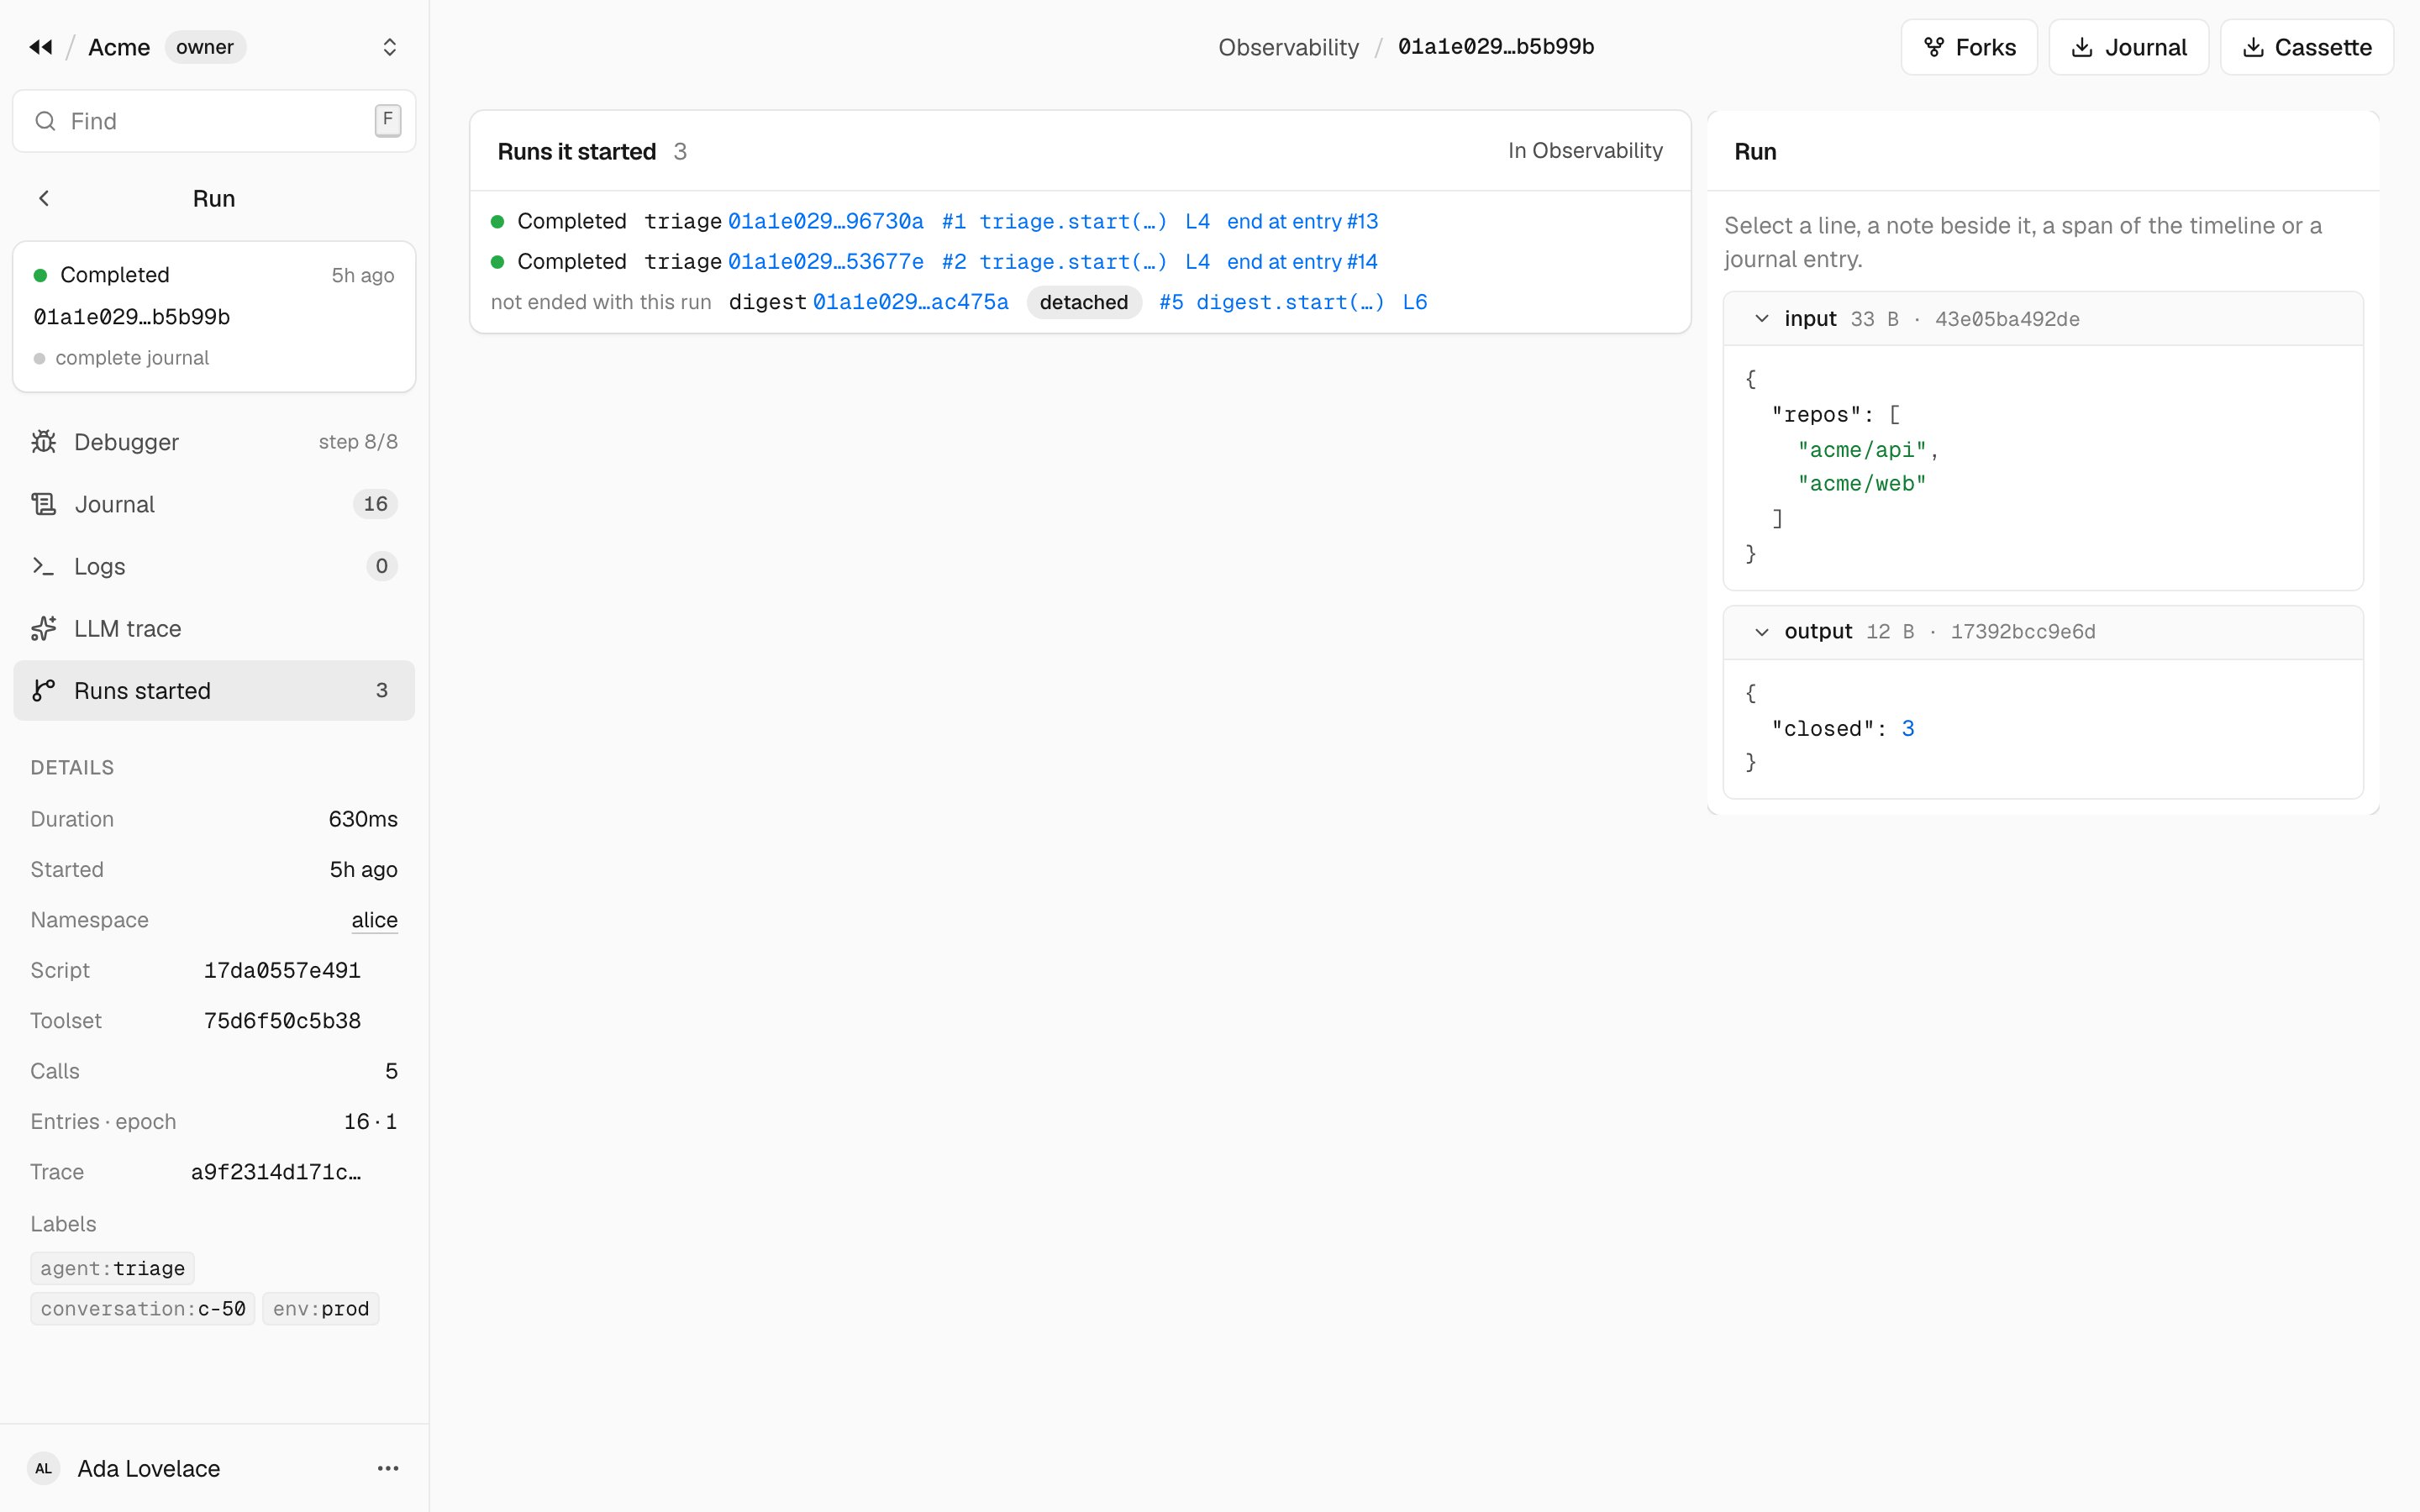
Runs started
The runs of workflows this run started, each with how it ended, the call that started it, and whether it is detached.triage.start(…) and run.signal("approval", …) read as the script wrote them.
Actions
At the top right:- Forks: the runs forked from this one, such as the
retry_runof a failed run. - Journal: downloads the run’s journal document, which replays on its own (
rewind replay journal.json). - Cassette: downloads its calls and signals, for tests.