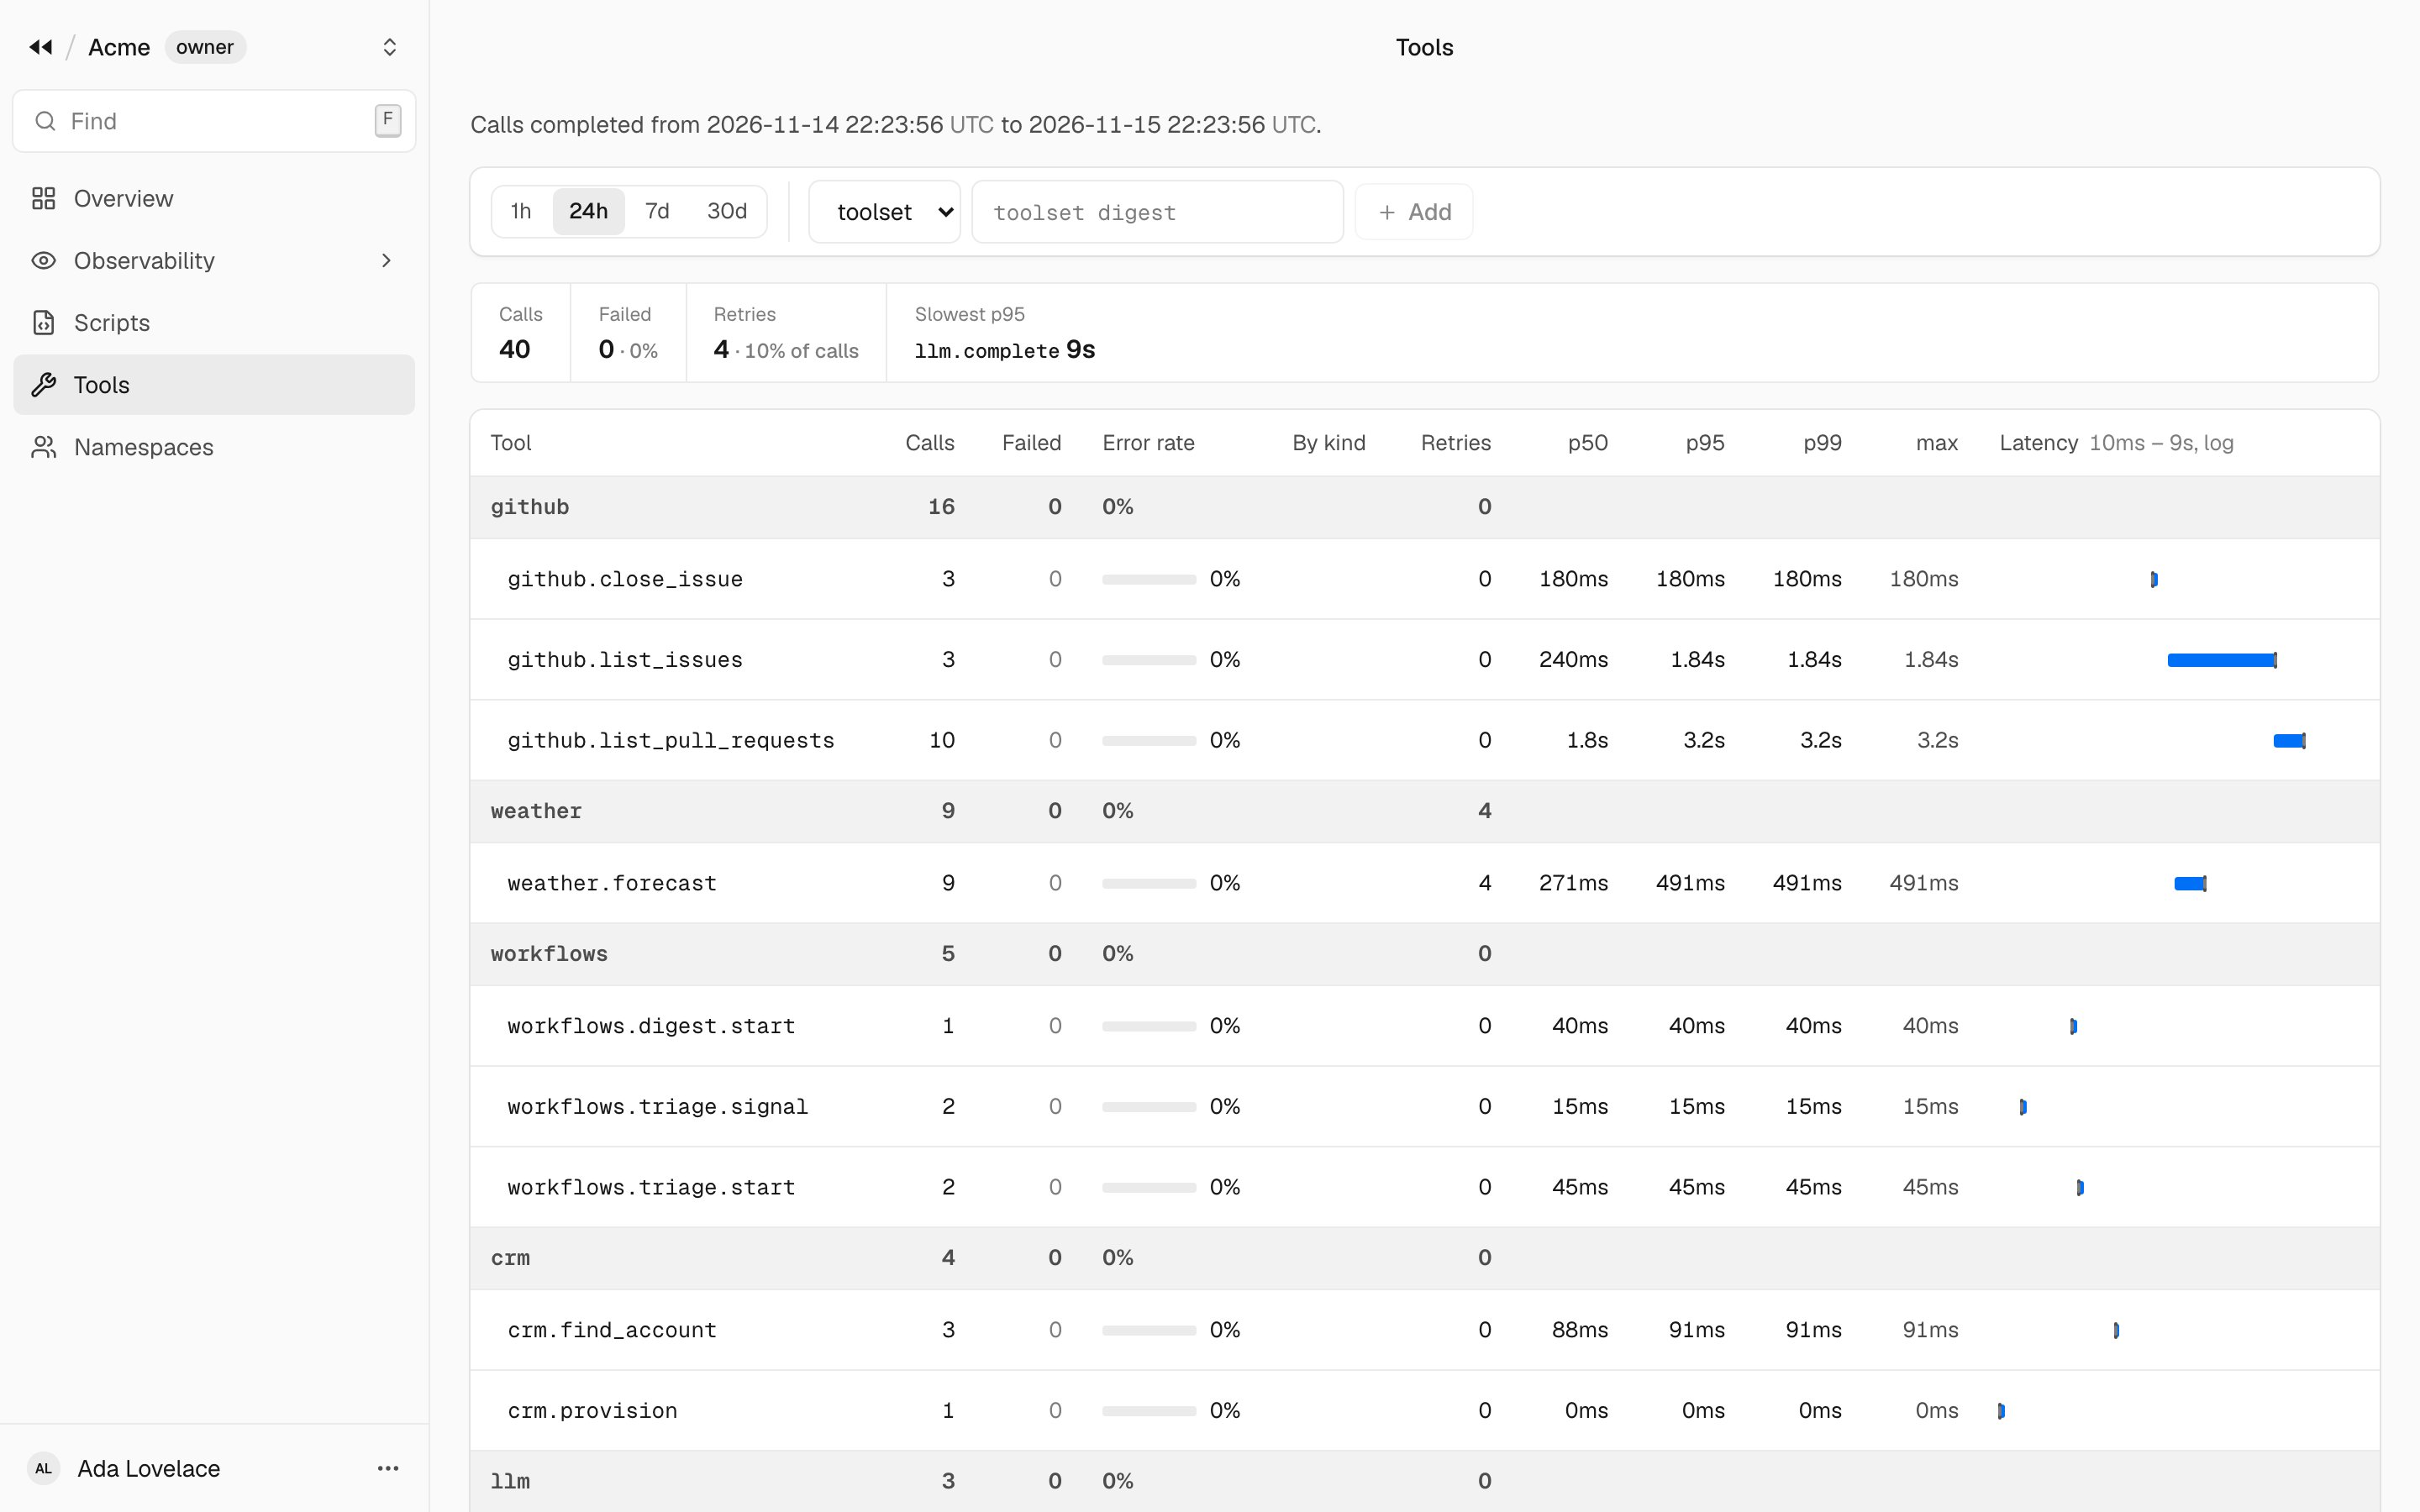
The Tools view measures the tools behind your runs over a window: the last hour, 24 hours, 7 or 30 days, optionally for one toolset.
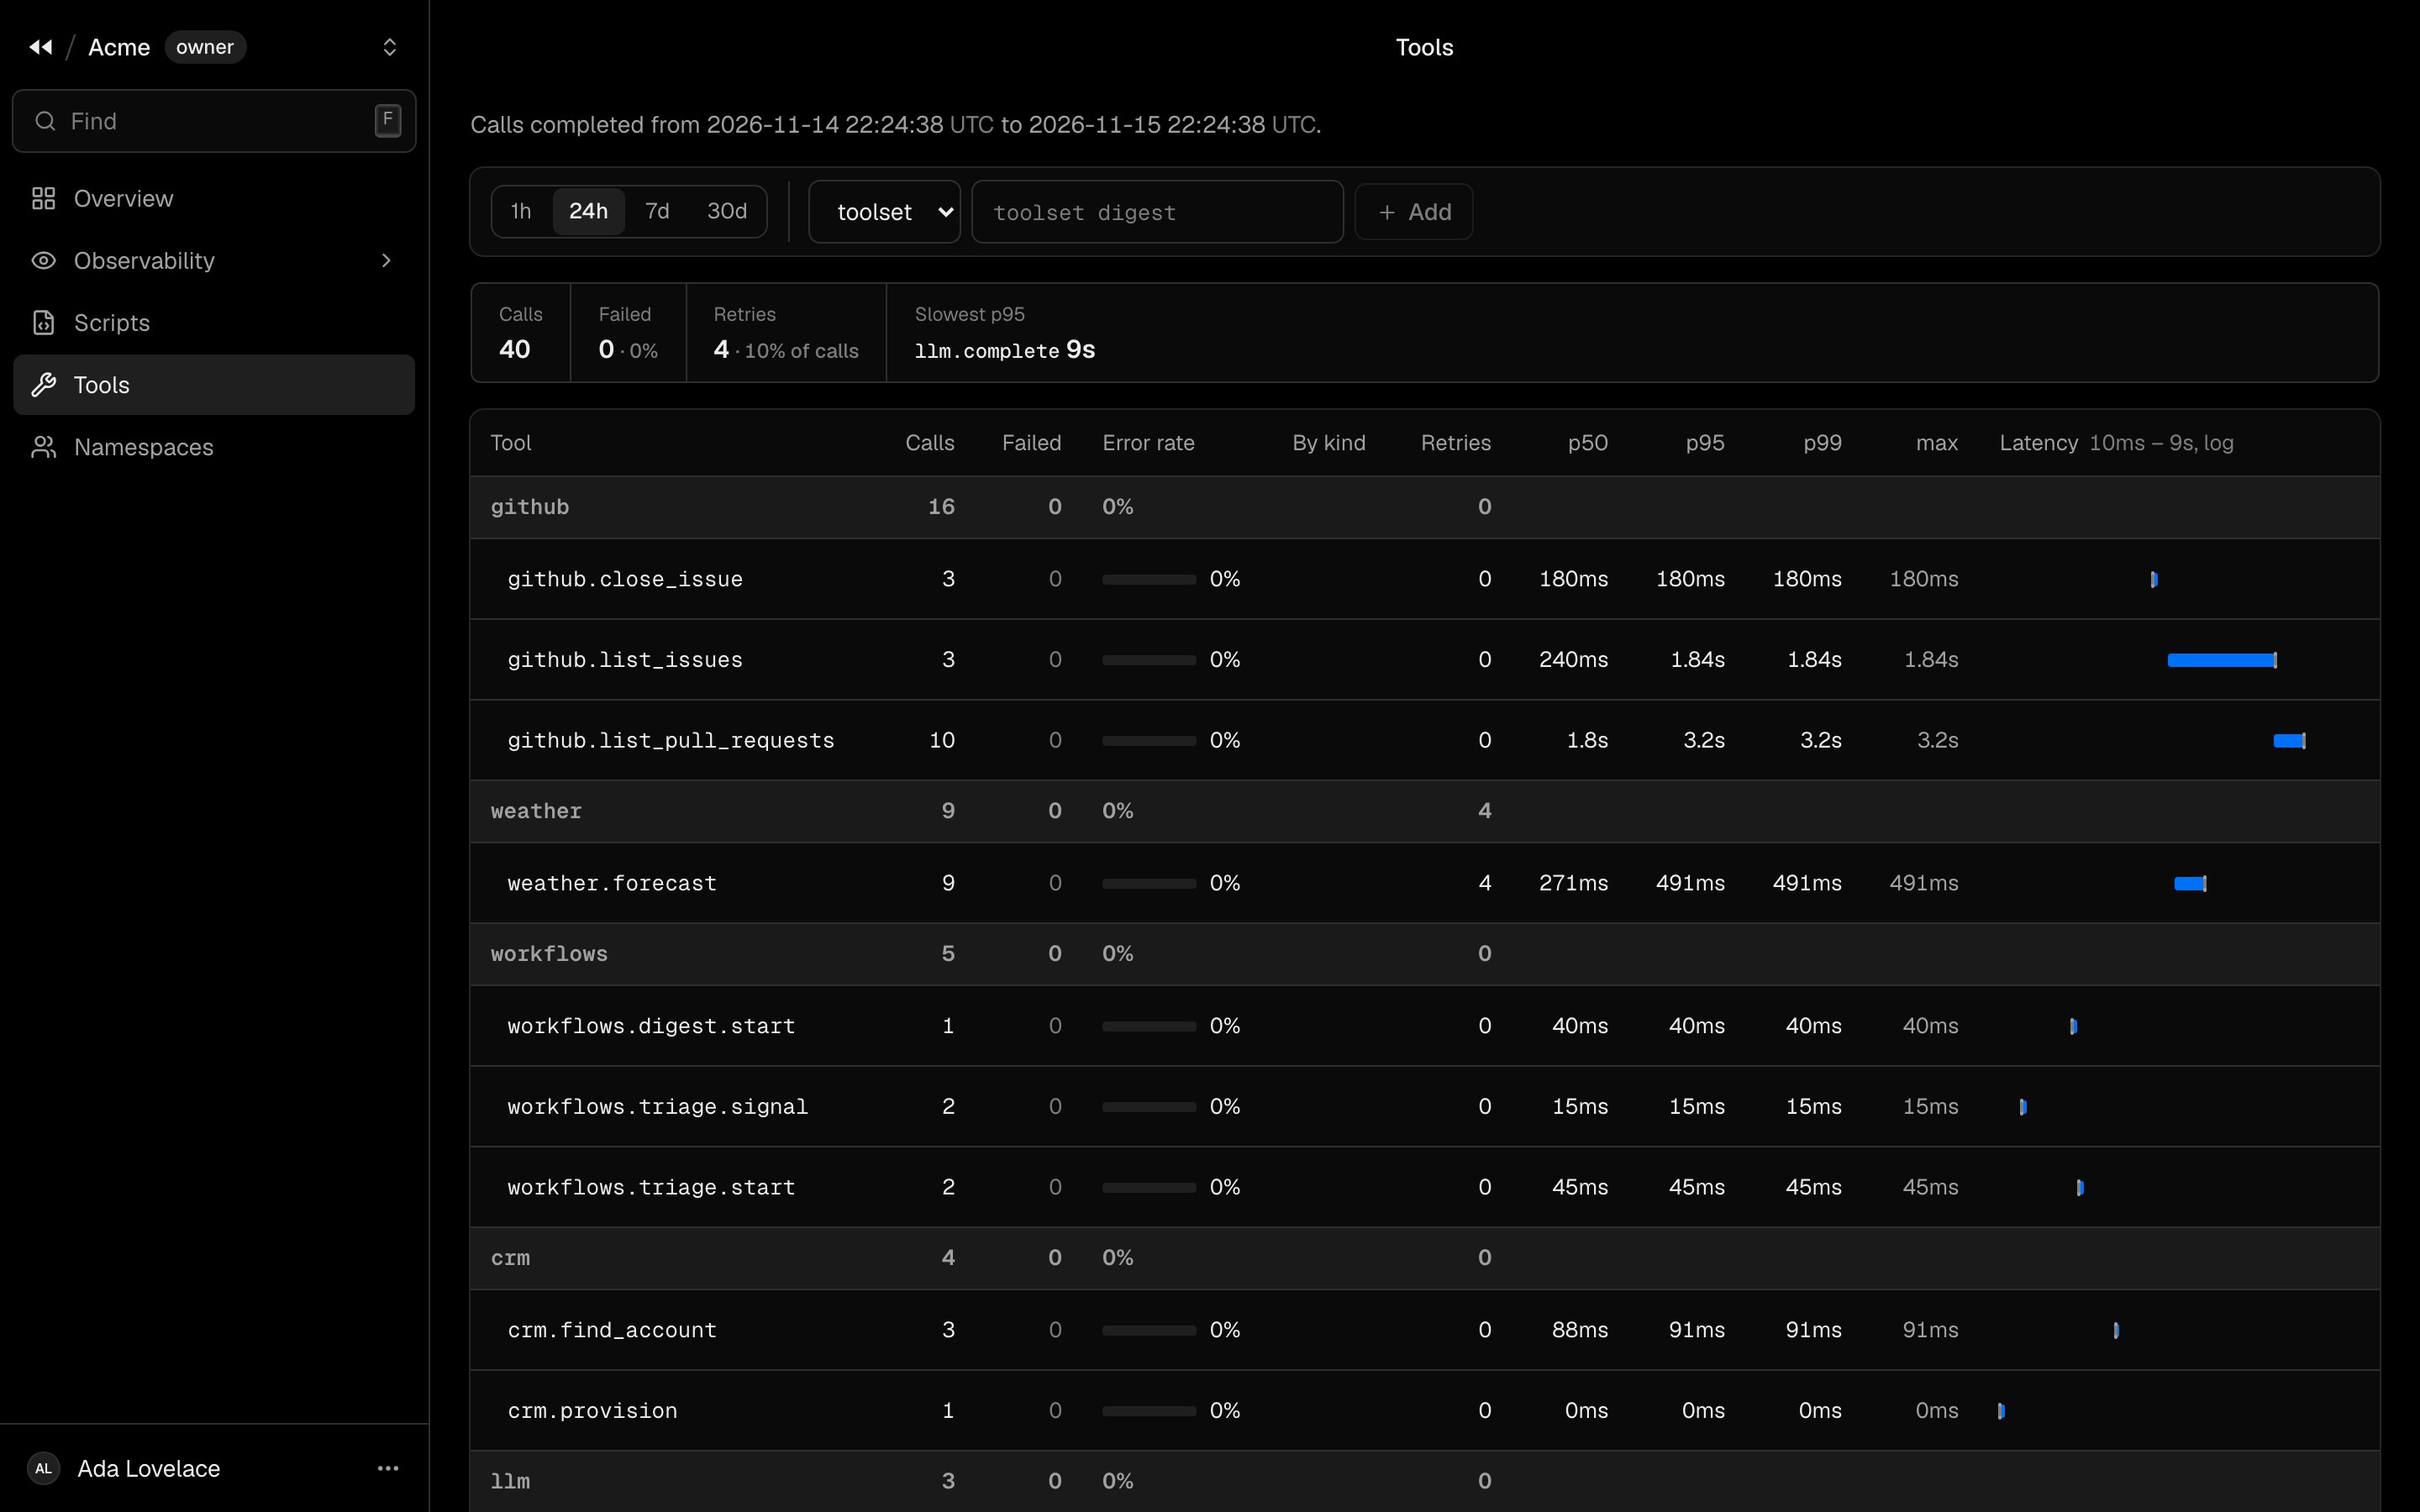
The Tools view: calls, failures, retries and latency percentiles per tool, grouped by serverThe Tools view: calls, failures, retries and latency percentiles per tool, grouped by server
At the top: the calls completed, how many failed, the retries, and the slowest tool. Then each tool, grouped by MCP server, group of host tools and built-ins: A slow or failing tool slows or fails every script that calls it: this is where to look when the Overview’s Failing tools lights up. The SDK reads the same figures with rewind.tools.stats(). The Tools view is not available to a member limited to labels.